can you please suggest how can I query the free memory (heap, stack) on RAK Wisblock4631 during runtime? Something similar I thought of like at: Arduino Playground - AvailableMemory
When trying that I have found error during compilation: " undefined reference to `__brkval’ " so came to the conclusion this library won’t work with Wisblock.
(My eventual goal with this is to rule out the cause of a random freeze of a modified version of the GPS tracker solution, altough root cause may as well be because of loosing LoRa connection I guess)
Heap and stack in the nRF52 are managed by FreeRTOS, the library you tried to use is for AVR MCU’s.
Try
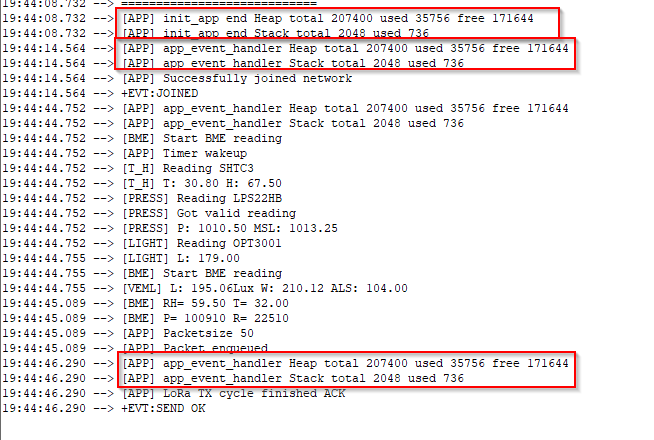
	Serial.printf("Heap total %d used %d free %d", dbgHeapTotal(), dbgHeapUsed(), dbgHeapFree());
	Serial.printf("Stack total %d used %d", dbgStackTotal(), dbgStackUsed());
It shows something like:
But keep in mind, that is the heap and stack assigned to the task that is asking. As FreeRTOS is a multitasking system, each task in the system has its own memory heap and stack size.
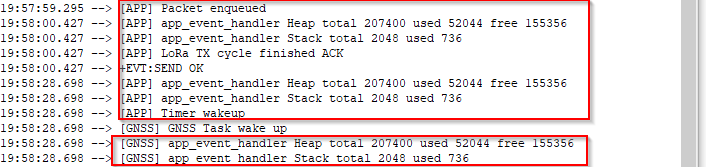
Just run a test with an app that has a separate task running and it shows me the same from both tasks.
Thanks for the pointer to these Bernd. I’ve been hacking at my own implementation of a stack and heap tracer.
RE: the dbgStackTotal() and dbgStackUsed() API, these seem to be reporting the stack stats using __StackTop/__StackLimit which looks to be the stack used by the SoftDevice and ISR, according to a comment in “cores/nRF5/linker/nrf52_common.ld” where they are defined. Which tracks your “same for both tasks” comment.
As you mentioned the individual “task” stacks are managed from the heap by the RTOS when the task is created.
The Stack Addr/Usage listed in the summary of dgbMeminfo() also is derived from the above two dbgStackXXX() API.
The output for the individual tasks seems to track ok though, so that’s good.
I’m dumping extra stack address info (start, next) but that did require modifying the RTOS source, which is not good. I’ll see if can make use of the underlying API that dbgMemInfo() uses, perhaps that will eliminate/reduce the customizing.