I have to relaunch packet forwarder every 1 or 2 days on RAK7243

Issue:See titls

Setup:RPI3b RAK7243

Server:Remote ChirpStack

Details:

Dear experts,

Every 1 or 2 days, I have to restart the Packet forwarder to get back to normal operation receiving message from nodes.
The Chirpstack server sees the gateway connected but none of my nodes can join or send.

I don’t know where to look for. Can’t see errors in messages log files.
Need advice to debug.

Thanks in advance

Patrice

Can it get back to normal when you reboot?
Can you check the version?
image

Yes, reboot or just packet forwarder restart get it back.
RAKWireless gateway RAK2245 version 4.1.0R

Server:Remote ChirpStack
What does the server stand for?

The gateway is connected to a chirpstack server running on another machine.

You can try to open the gateway’s foreground process to check if the gateway itself failed?

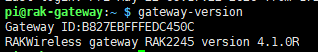
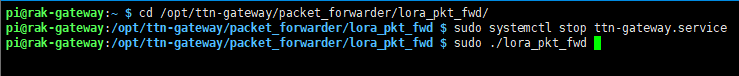
*** Beacon Packet Forwarder for Lora Gateway ***

Version: 4.0.1
*** Lora concentrator HAL library version info ***
Version: 5.0.1;


INFO: Little endian host
INFO: found global configuration file global_conf.json, parsing it
INFO: global_conf.json does contain a JSON object named SX1301_conf, parsing SX1301 parameters
INFO: lorawan_public 1, clksrc 1
INFO: no configuration for LBT
INFO: antenna_gain 0 dBi
INFO: Configuring TX LUT with 16 indexes
INFO: radio 0 enabled (type SX1257), center frequency 867500000, RSSI offset -166.000000, tx enabled 1, tx_notch_freq 0
INFO: radio 1 enabled (type SX1257), center frequency 868500000, RSSI offset -166.000000, tx enabled 0, tx_notch_freq 0
INFO: Lora multi-SF channel 0> radio 1, IF -400000 Hz, 125 kHz bw, SF 7 to 12
INFO: Lora multi-SF channel 1> radio 1, IF -200000 Hz, 125 kHz bw, SF 7 to 12
INFO: Lora multi-SF channel 2> radio 1, IF 0 Hz, 125 kHz bw, SF 7 to 12
INFO: Lora multi-SF channel 3> radio 0, IF -400000 Hz, 125 kHz bw, SF 7 to 12
INFO: Lora multi-SF channel 4> radio 0, IF -200000 Hz, 125 kHz bw, SF 7 to 12
INFO: Lora multi-SF channel 5> radio 0, IF 0 Hz, 125 kHz bw, SF 7 to 12
INFO: Lora multi-SF channel 6> radio 0, IF 200000 Hz, 125 kHz bw, SF 7 to 12
INFO: Lora multi-SF channel 7> radio 0, IF 400000 Hz, 125 kHz bw, SF 7 to 12
INFO: Lora std channel> radio 1, IF -200000 Hz, 250000 Hz bw, SF 7
INFO: FSK channel> radio 1, IF 300000 Hz, 125000 Hz bw, 50000 bps datarate
INFO: global_conf.json does contain a JSON object named gateway_conf, parsing gateway parameters
INFO: gateway MAC address is configured to 0000000000000000
INFO: server hostname or IP address is configured to “192.168.1.12”
INFO: upstream port is configured to “1700”
INFO: downstream port is configured to “1700”
INFO: downstream keep-alive interval is configured to 10 seconds
INFO: statistics display interval is configured to 30 seconds
INFO: upstream PUSH_DATA time-out is configured to 100 ms
INFO: packets received with a valid CRC will be forwarded
INFO: packets received with a CRC error will NOT be forwarded
INFO: packets received with no CRC will NOT be forwarded
INFO: GPS serial port path is configured to “/dev/ttyAMA0”
INFO: Reference latitude is configured to 10.000000 deg
INFO: Reference longitude is configured to 20.000000 deg
INFO: Reference altitude is configured to -1 meters
INFO: fake GPS is disabled
INFO: Auto-quit after 20 non-acknowledged PULL_DATA
INFO: found local configuration file local_conf.json, parsing it
INFO: redefined parameters will overwrite global parameters
INFO: local_conf.json does not contain a JSON object named SX1301_conf
INFO: local_conf.json does contain a JSON object named gateway_conf, parsing gateway parameters
INFO: gateway MAC address is configured to B827EBFFFE7F9480
INFO: packets received with a valid CRC will be forwarded
INFO: packets received with a CRC error will NOT be forwarded
INFO: packets received with no CRC will NOT be forwarded
INFO: [main] TTY port /dev/ttyAMA0 open for GPS synchronization
INFO: [main] concentrator started, packet can now be received

INFO: Disabling GPS mode for concentrator’s counter…
INFO: host/sx1301 time offset=(1590401607s:640673µs) - drift=987735649µs
INFO: Enabling GPS mode for concentrator’s counter.

WARNING: [gps] GPS out of sync, keeping previous time reference
INFO: [down] PULL_ACK received in 4 ms
INFO: [down] PULL_ACK received in 3 ms
INFO: [down] PULL_ACK received in 2 ms

2020-05-25 10:14:00 GMT

[UPSTREAM]

RF packets received by concentrator: 1

CRC_OK: 0.00%, CRC_FAIL: 100.00%, NO_CRC: 0.00%

RF packets forwarded: 0 (0 bytes)

PUSH_DATA datagrams sent: 0 (0 bytes)

PUSH_DATA acknowledged: 0.00%

[DOWNSTREAM]

PULL_DATA sent: 3 (100.00% acknowledged)

PULL_RESP(onse) datagrams received: 0 (0 bytes)

RF packets sent to concentrator: 0 (0 bytes)

TX errors: 0

BEACON queued: 0

BEACON sent so far: 0

BEACON rejected: 0

[JIT]

SX1301 time (PPS): 32358452

src/jitqueue.c:448:jit_print_queue(): INFO: [jit] queue is empty

[GPS]

Valid time reference (age: 0 sec)

GPS coordinates: latitude 49.01690, longitude 2.13251, altitude 47 m

END

JSON up: {“stat”:{“time”:“2020-05-25 10:14:00 GMT”,“lati”:49.01690,“long”:2.13251,“alti”:47,“rxnb”:1,“rxok”:0,“rxfw”:0,“ackr”:0.0,“dwnb”:0,“txnb”:0}}
INFO: [up] PUSH_ACK received in 6 ms
INFO: [down] PULL_ACK received in 2 ms
INFO: [down] PULL_ACK received in 5 ms
INFO: [down] PULL_ACK received in 3 ms

INFO: Received pkt from mote: ED03CFD9 (fcnt=65026)

JSON up: {“rxpk”:[{“tmst”:58603019,“time”:“2020-05-25T10:14:25.244563Z”,“tmms”:1274436884244,“chan”:1,“rfch”:1,“freq”:868.300000,“stat”:1,“modu”:“LORA”,“datr”:“SF7BW125”,“codr”:“4/5”,“lsnr”:-7.0,“rssi”:-121,“size”:9,“data”:“BNnPA+3sAv4B”}]}
INFO: [up] PUSH_ACK received in 3 ms

INFO: Received pkt from mote: 0F3563D5 (fcnt=385)

JSON up: {“rxpk”:[{“tmst”:58696244,“time”:“2020-05-25T10:14:25.337788Z”,“tmms”:1274436884337,“chan”:7,“rfch”:0,“freq”:867.900000,“stat”:1,“modu”:“LORA”,“datr”:“SF12BW125”,“codr”:“4/5”,“lsnr”:-13.5,“rssi”:-125,“size”:15,“data”:“QNVjNQ8AgQECyW7/c/sL”}]}
INFO: [up] PUSH_ACK received in 6 ms

INFO: Received pkt from mote: 00C314CF (fcnt=1352)

JSON up: {“rxpk”:[{“tmst”:58852628,“time”:“2020-05-25T10:14:25.494172Z”,“tmms”:1274436884494,“chan”:7,“rfch”:0,“freq”:867.900000,“stat”:1,“modu”:“LORA”,“datr”:“SF7BW125”,“codr”:“4/5”,“lsnr”:10.5,“rssi”:-67,“size”:17,“data”:“QM8UwwCASAUBVufLh2GR6Ag=”}]}
INFO: [up] PUSH_ACK received in 5 ms

Running the foreground probably isn’t going to help as it may take hours to days for the failure to occur. You’d need to set up something to capture the logs continuously - might as well let the daemons run normally in the background and look in journalctl/syslog.

It would be useful to understand the current mechanism of communication between the gateway and chirpstack server. A while back when the architecture was to run a bridge program on the gateway which translated from the semtech UDP protocol to MQTT to submit the gateway data to Chirpstack (which was then called LoRaServer) the gateway bridge program had a habit of getting stuck in response to certain MQTT glitches and not reconnecting. That would be an example of the packet forwarder continuing to work, but other failures are possible too.

Really the key is to understand how the pieces fit together and check in between them.

You should be able to get logs server-side, too.

It seems that the issue is more on the lorawan side. It’s like if the rak2245 was not receiving traffic or not listening.

Perhaps, but how have you narrowed it to that?

You really need logs from the time period when it was failing, and ideally covering the transition from normal operation to failure.

Looks like your gateway is pi-based and running a full Linux, so they may well be there. Read on how to use journalctl (or directly access syslog, including the gzipped rotated older files), get the timeframe of a period of failure and see what you can find.

Is there any specific log or it is located in message

I’d look at everything but especially syslog and messages.

Try to see what normal operation looks like, and compare that to anything different in the timeframe of the failure or preceding it.

Look not only for LoRaWAN specific things but also things like filesystem or memory issues, date errors, Linux getting generally “confused” etc.

Once again, RF stopped to receive.
here is the syslog I get

May 26 12:32:53 rak-gateway ttn-gateway[4839]: JSON up: {“stat”:{“time”:“2020-05-26 10:32:23 GMT”,“lati”:49.01688,“long”:2.13247,“alti”:43,“rxnb”:5,“rxok”:3,“rxfw”:3,“ackr”:100.0,“dwnb”:1,“txnb”:1}}
May 26 12:32:53 rak-gateway ttn-gateway[4839]: JSON up: {“rxpk”:[{“tmst”:3639194619,“time”:“2020-05-26T10:32:39.031474Z”,“tmms”:1274524378031,“chan”:1,“rfch”:1,“freq”:868.300000,“stat”:1,“modu”:“LORA”,“datr”:“SF7BW125”,“codr”:“4/5”,“lsnr”:9.5,“rssi”:-52,“size”:23,“data”:“AOqNAtB+1bNwLyubvsQYIgByhw3mZ/0=”}]}
May 26 12:32:53 rak-gateway ttn-gateway[4839]: JSON down: {“txpk”:{“imme”:false,“rfch”:0,“powe”:14,“ant”:0,“brd”:0,“tmst”:3644194619,“freq”:868.3,“modu”:“LORA”,“datr”:“SF7BW125”,“codr”:“4/5”,“ipol”:true,“size”:33,“data”:“ILYgVgHW39IKAxosKavZFbqXzMa6dZslkcJzYtXVYNNJ”}}
May 26 12:32:53 rak-gateway ttn-gateway[4839]: JSON up: {“rxpk”:[{“tmst”:3644357572,“time”:“2020-05-26T10:32:44.194429Z”,“tmms”:1274524383194,“chan”:6,“rfch”:0,“freq”:867.700000,“stat”:1,“modu”:“LORA”,“datr”:“SF7BW125”,“codr”:“4/5”,“lsnr”:9.5,“rssi”:-49,“size”:23,“data”:“QJ6psQAAAAAKsB1v4LydLjMl2EFaMCo=”}]}
May 26 12:33:53 rak-gateway ttn-gateway[4839]: JSON up: {“stat”:{“time”:“2020-05-26 10:32:53 GMT”,“lati”:49.01688,“long”:2.13247,“alti”:43,“rxnb”:3,“rxok”:2,“rxfw”:2,“ackr”:100.0,“dwnb”:1,“txnb”:1}}
May 26 12:33:53 rak-gateway ttn-gateway[4839]: JSON up: {“stat”:{“time”:“2020-05-26 10:33:23 GMT”,“lati”:49.01687,“long”:2.13245,“alti”:48,“rxnb”:40,“rxok”:0,“rxfw”:0,“ackr”:0.0,“dwnb”:0,“txnb”:0}}
May 26 12:35:23 rak-gateway ttn-gateway[4839]: JSON up: {“stat”:{“time”:“2020-05-26 10:33:53 GMT”,“lati”:49.01690,“long”:2.13246,“alti”:47,“rxnb”:40,“rxok”:0,“rxfw”:0,“ackr”:100.0,“dwnb”:0,“txnb”:0}}
May 26 12:35:23 rak-gateway ttn-gateway[4839]: JSON up: {“stat”:{“time”:“2020-05-26 10:34:23 GMT”,“lati”:49.01691,“long”:2.13246,“alti”:42,“rxnb”:34,“rxok”:0,“rxfw”:0,“ackr”:100.0,“dwnb”:0,“txnb”:0}}
May 26 12:35:23 rak-gateway ttn-gateway[4839]: JSON up: {“stat”:{“time”:“2020-05-26 10:34:53 GMT”,“lati”:49.01690,“long”:2.13246,“alti”:46,“rxnb”:37,“rxok”:0,“rxfw”:0,“ackr”:100.0,“dwnb”:0,“txnb”:0}}
May 26 12:36:53 rak-gateway ttn-gateway[4839]: JSON up: {“stat”:{“time”:“2020-05-26 10:35:23 GMT”,“lati”:49.01690,“long”:2.13246,“alti”:47,“rxnb”:38,“rxok”:0,“rxfw”:0,“ackr”:100.0,“dwnb”:0,“txnb”:0}}
May 26 12:36:53 rak-gateway ttn-gateway[4839]: JSON up: {“stat”:{“time”:“2020-05-26 10:35:53 GMT”,“lati”:49.01690,“long”:2.13247,“alti”:49,“rxnb”:46,“rxok”:0,“rxfw”:0,“ackr”:100.0,“dwnb”:0,“txnb”:0}}

I can’t see any error on the full syslog or messages.
I suspect a problem with RAK2245.

The question now is to find how to see specific elements from RAK2245.

now I see a lot of
May 26 13:29:02 rak-gateway ttn-gateway[1038]: # CRC_OK: 0.00%, CRC_FAIL: 100.00%, NO_CRC: 0.00%

Thinking now of a temperature issue. The box is quite hot.

1 Like

Temperature of the concentrator card itself could be something to look at.

One thing to note is that it is “receiving” packets at a much higher rate than before (rxnb number) but all of them are errors so the the rxok and rxfw stay zero.

Probably most of those are not actual packets to begin with but false detections.

If it were a thermal issue, then restarting the packet forwader probably wouldn’t fix it for long, yes the chip would be in reset and low power modes for a few seconds but if it were previously overheating it would be back there within minutes.

You can’t see any errors from the log. Can you connect to the built-in server instead?

The log does provide some key information about the nature of the failure.

The large number of “rxnb” in the status message combined with the zero “rxok” indicates that the only “packets” being received by the concentrator hardware are not even valid LoRa packets, but fail CRC or have framing errors or similar defects. Given the rate of these incidents is higher than that of the legitimate packets earlier in the log, most probably are not packets from nodes at all, but false detections.

Such defective packets aren’t even reported to the server (“rxfw” is shown as 0) so presumably the server logs show no radio operations occurring at all.

oh,Only the gateway log is opened and no data is sent, which shows the gateway’s heartbeat packet.
Is that so?

Yes, gateway is still connected but RF seems to be down. I’m really thinking on a temp issue with the RAK2245.

Can not you collect any data now? I suggest you try a new server.