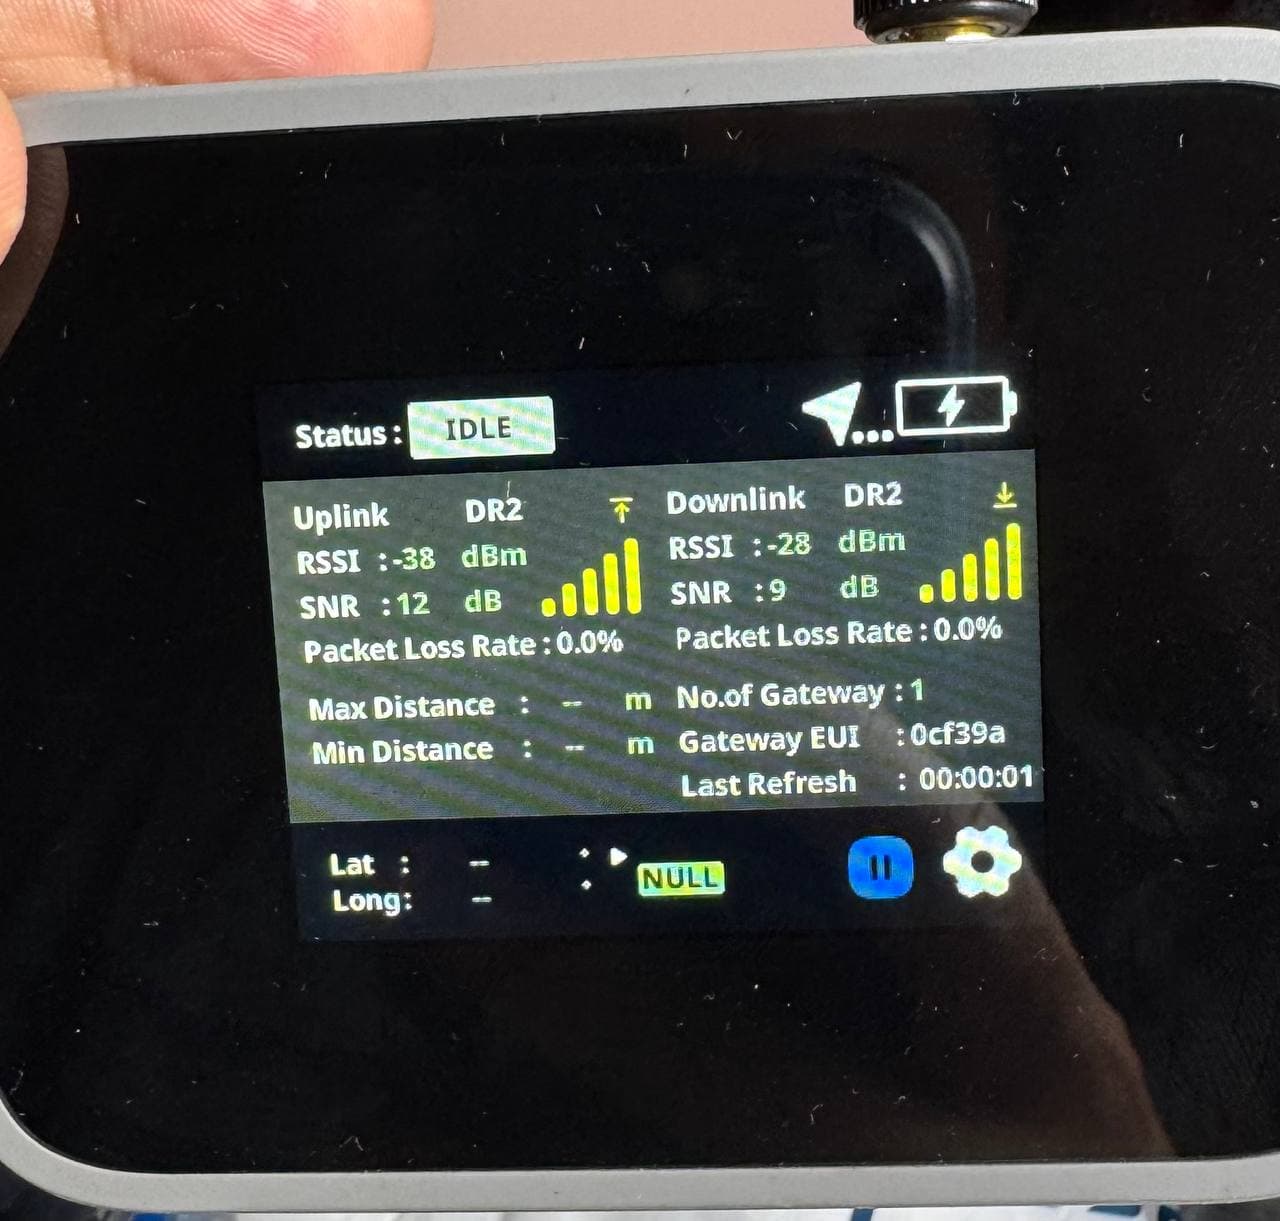
RAK10701 No Uplink Meassurements DIsplayed

Hello,

When using the RAK10701 it only displays measurements for the downlinks and not for the uplinks. Also, the Downlink measurements always state that the No. of gateways is 1, even though I can see multiple gateways connected over the LNS.

Also does the node work when testing the signal in cellars, when there is no GPS connection?

Cheers Tom

Welcome to RAK forum Tom.

The RAK10701-Plus requires the Field Data processor extension so you can have an uplink parameters. At the moment, it work on linkcheck mode.

It will work indoors but since there is no GPS, it will not have distance measurement readings.

1 Like

Thanks for answering Carlo.

How does you get the extension?
And concerning my question about the wrongfully displayed number of gateways?

Hi @berlinenergielorawan ,

The guide for the Field Tester extension is here - RAK10701-Plus Field Tester for LoRaWAN Network Setup and LNS Configuration Guide

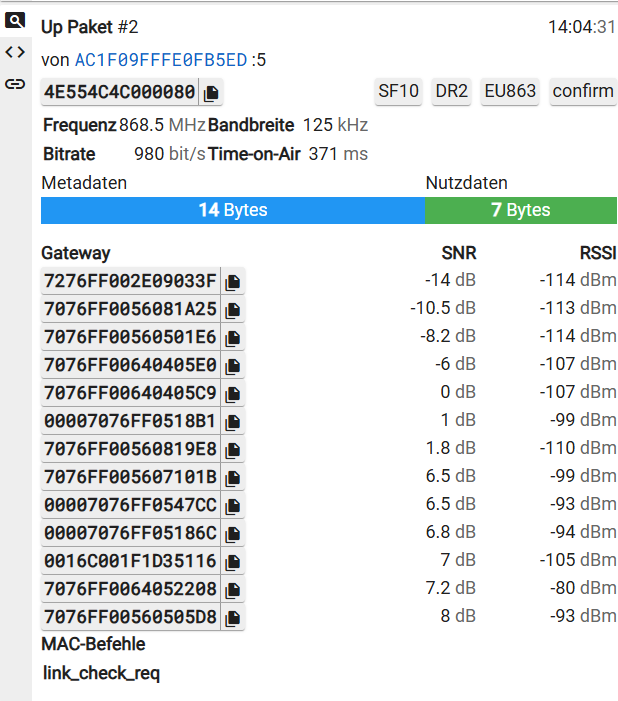
As for the other topic, can you share the device logs on the LNS console that shows multiple gateways but the display is still 1? It is based on RUI3 LinkCheck routine and this is my first time to see this issue.

I have the exact same situation. However, I deployed Node-Red and the field tester service. I see the downlink message go out to the field tester RAK10701-Plus, but the uplink is not showing any information on the tester itself, and it does not show the distances. Is the format of the Plus different than it was with -P models which we previously purchased? Even though I see the queue on fPort 2 with the right payload, it seems the field tester does not know what to do with that data.
We make our own gateways with other applications, and cannot be using the rak extension. We were using node-red’s implementation before with -L and -P models, so how can make this work. This is urgent for us.


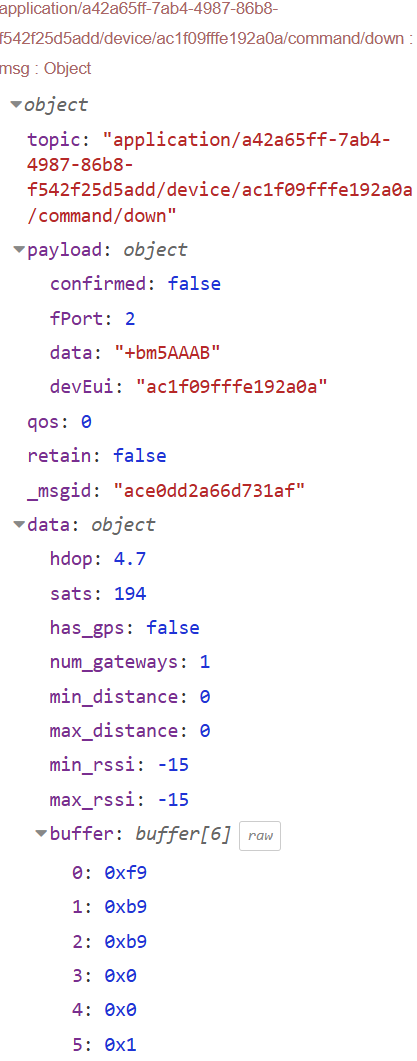
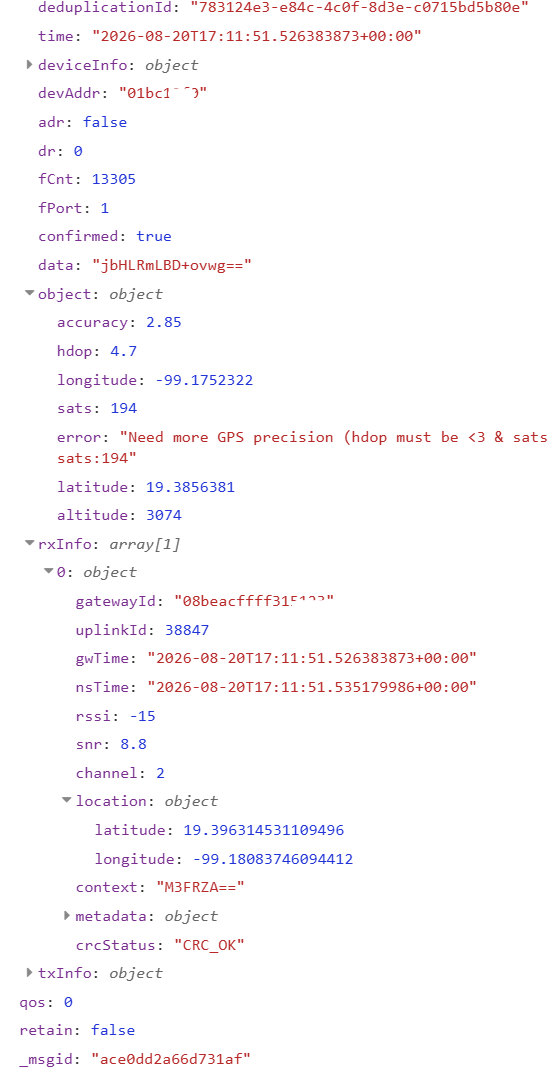
The uplink message.

The response from node-red service to mqtt that gets queued and sent from Chirpstack4 to the end node field tester.

I also have sent the uplink fPort 10 to get out of linkcheck mode, which looks like that did allow all the uplink data coming in. That works okay as we see the tester’s data in Chirpstack4 MQTT and Datacake come in. In Datacake, it can’t complete some of its functions and the decoder was for the -L model, so we tried the NodeRed methods to try and get further details.
Downlink queue 76312E312E30 fPort 10 unlocked it out of linkcheck mode.
Tester was updated to 1.0.1 firmware using app.

Hello Carlo,

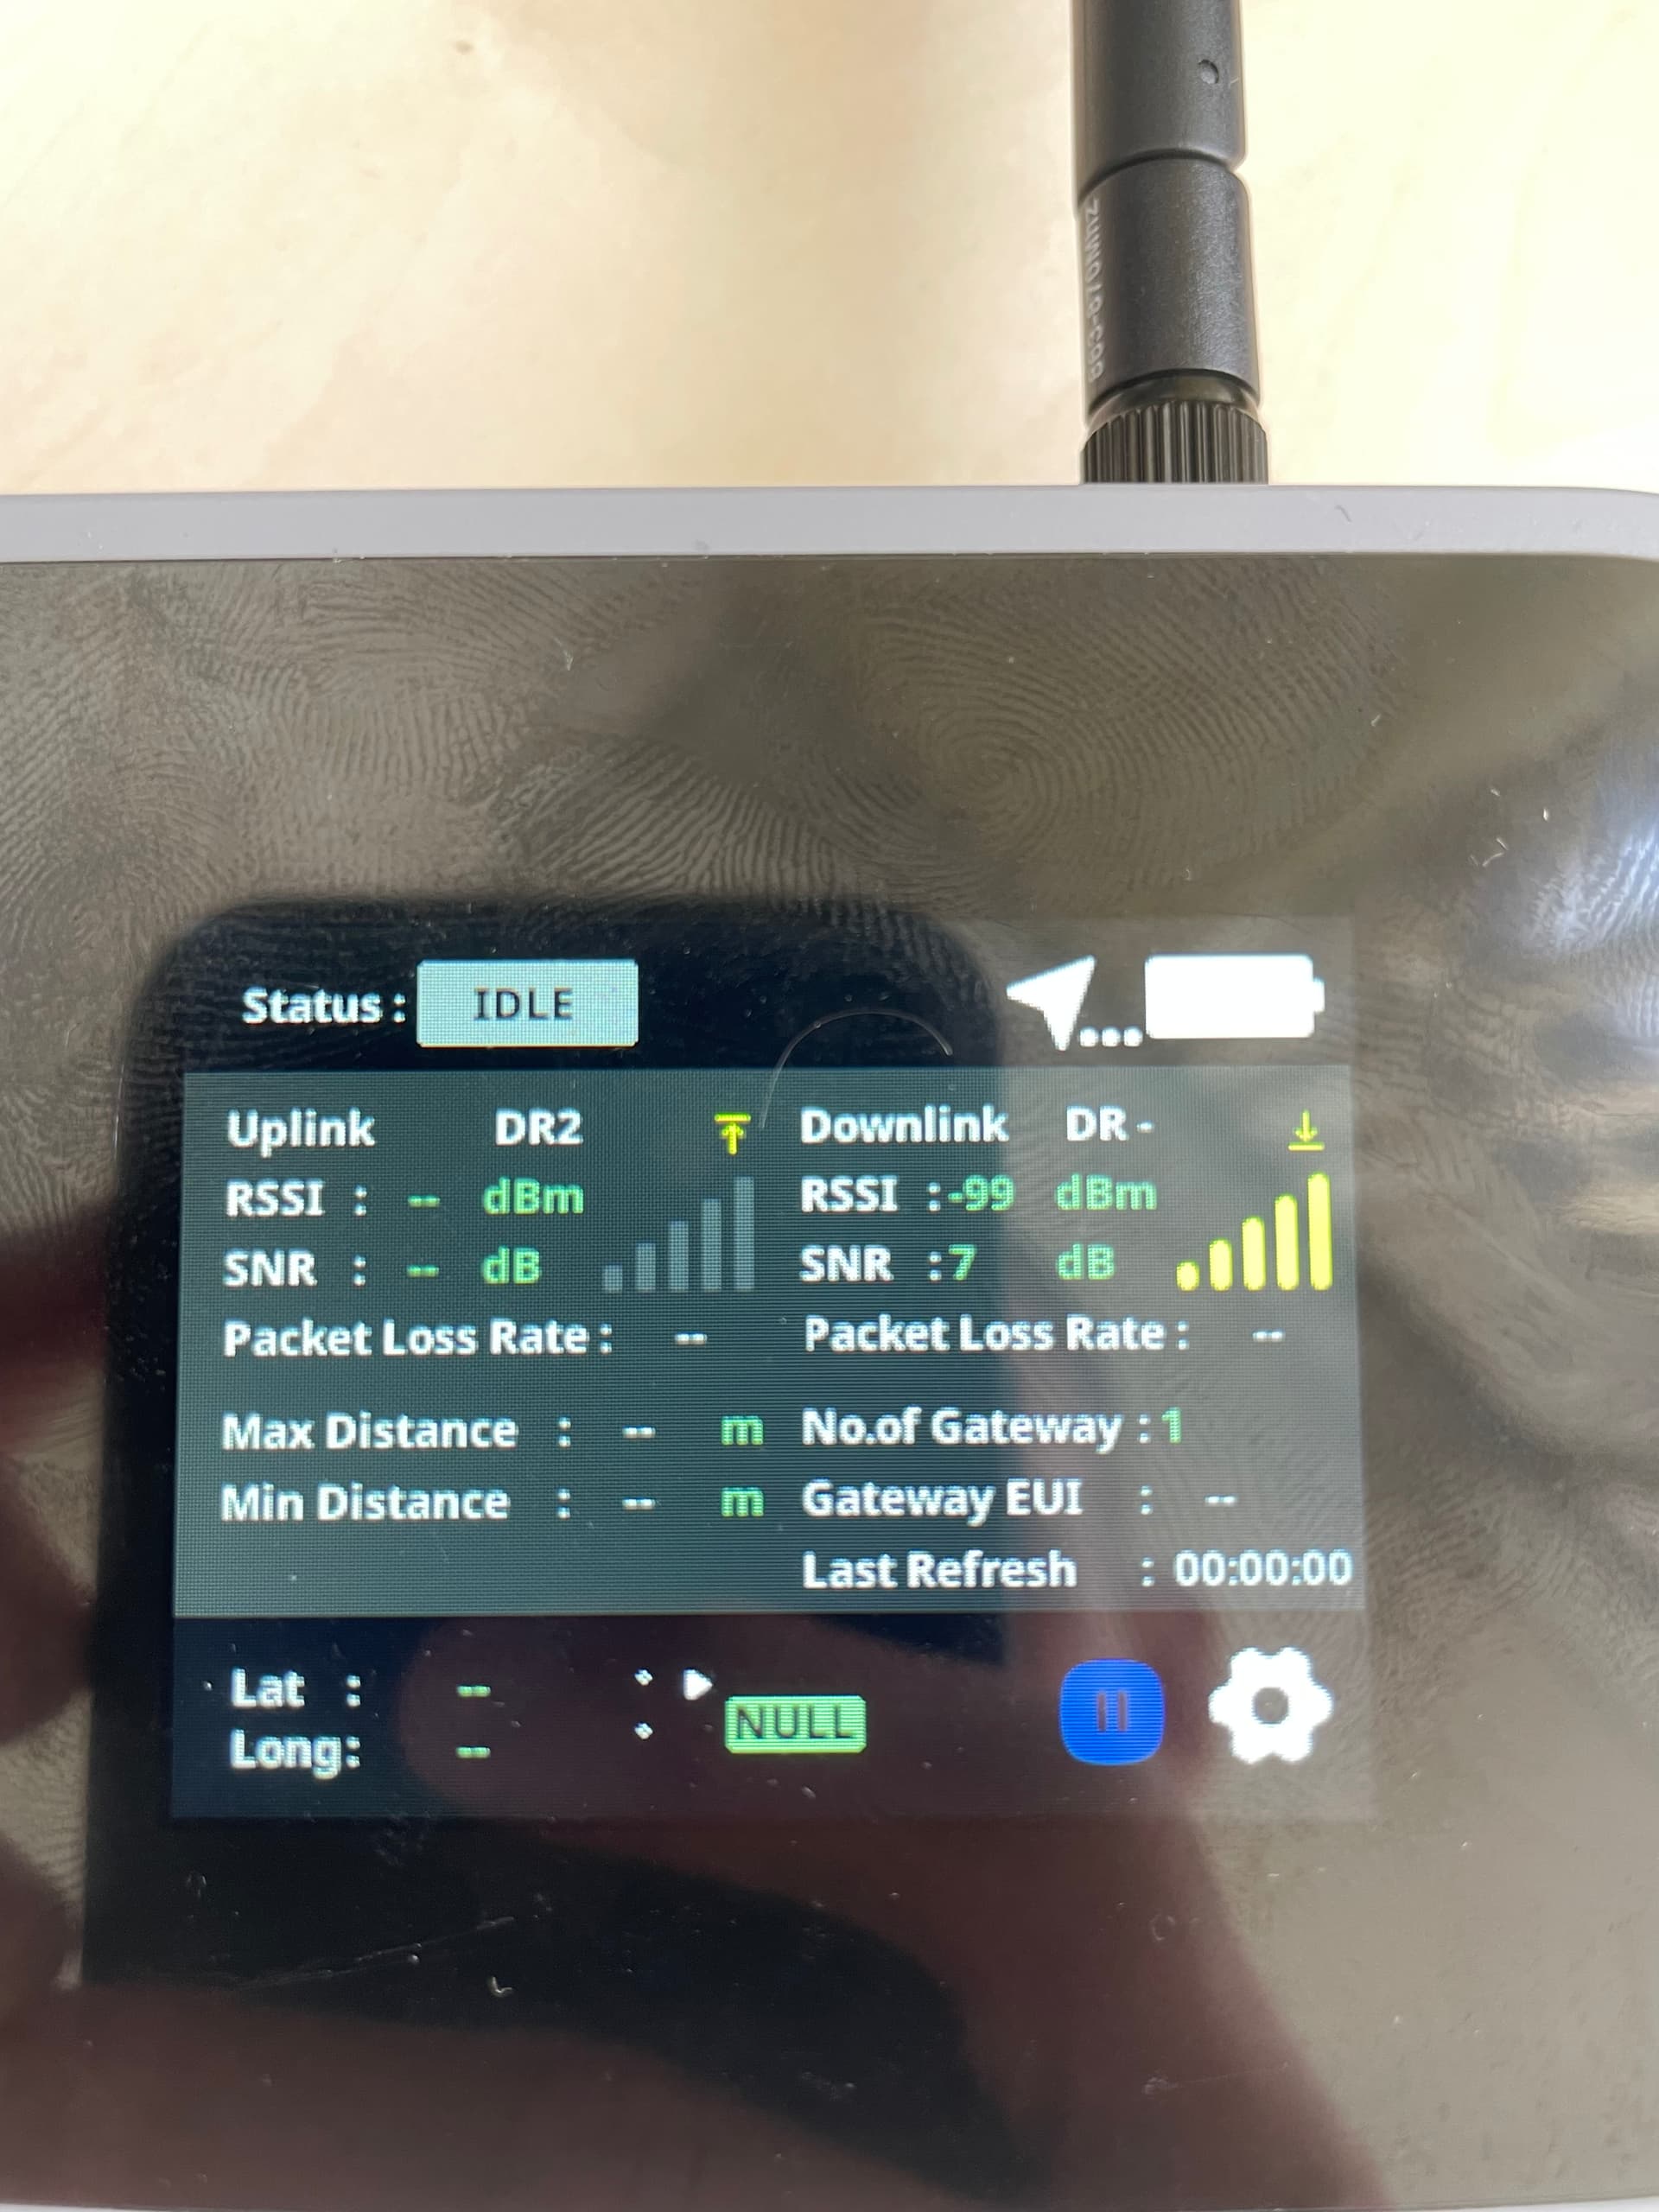
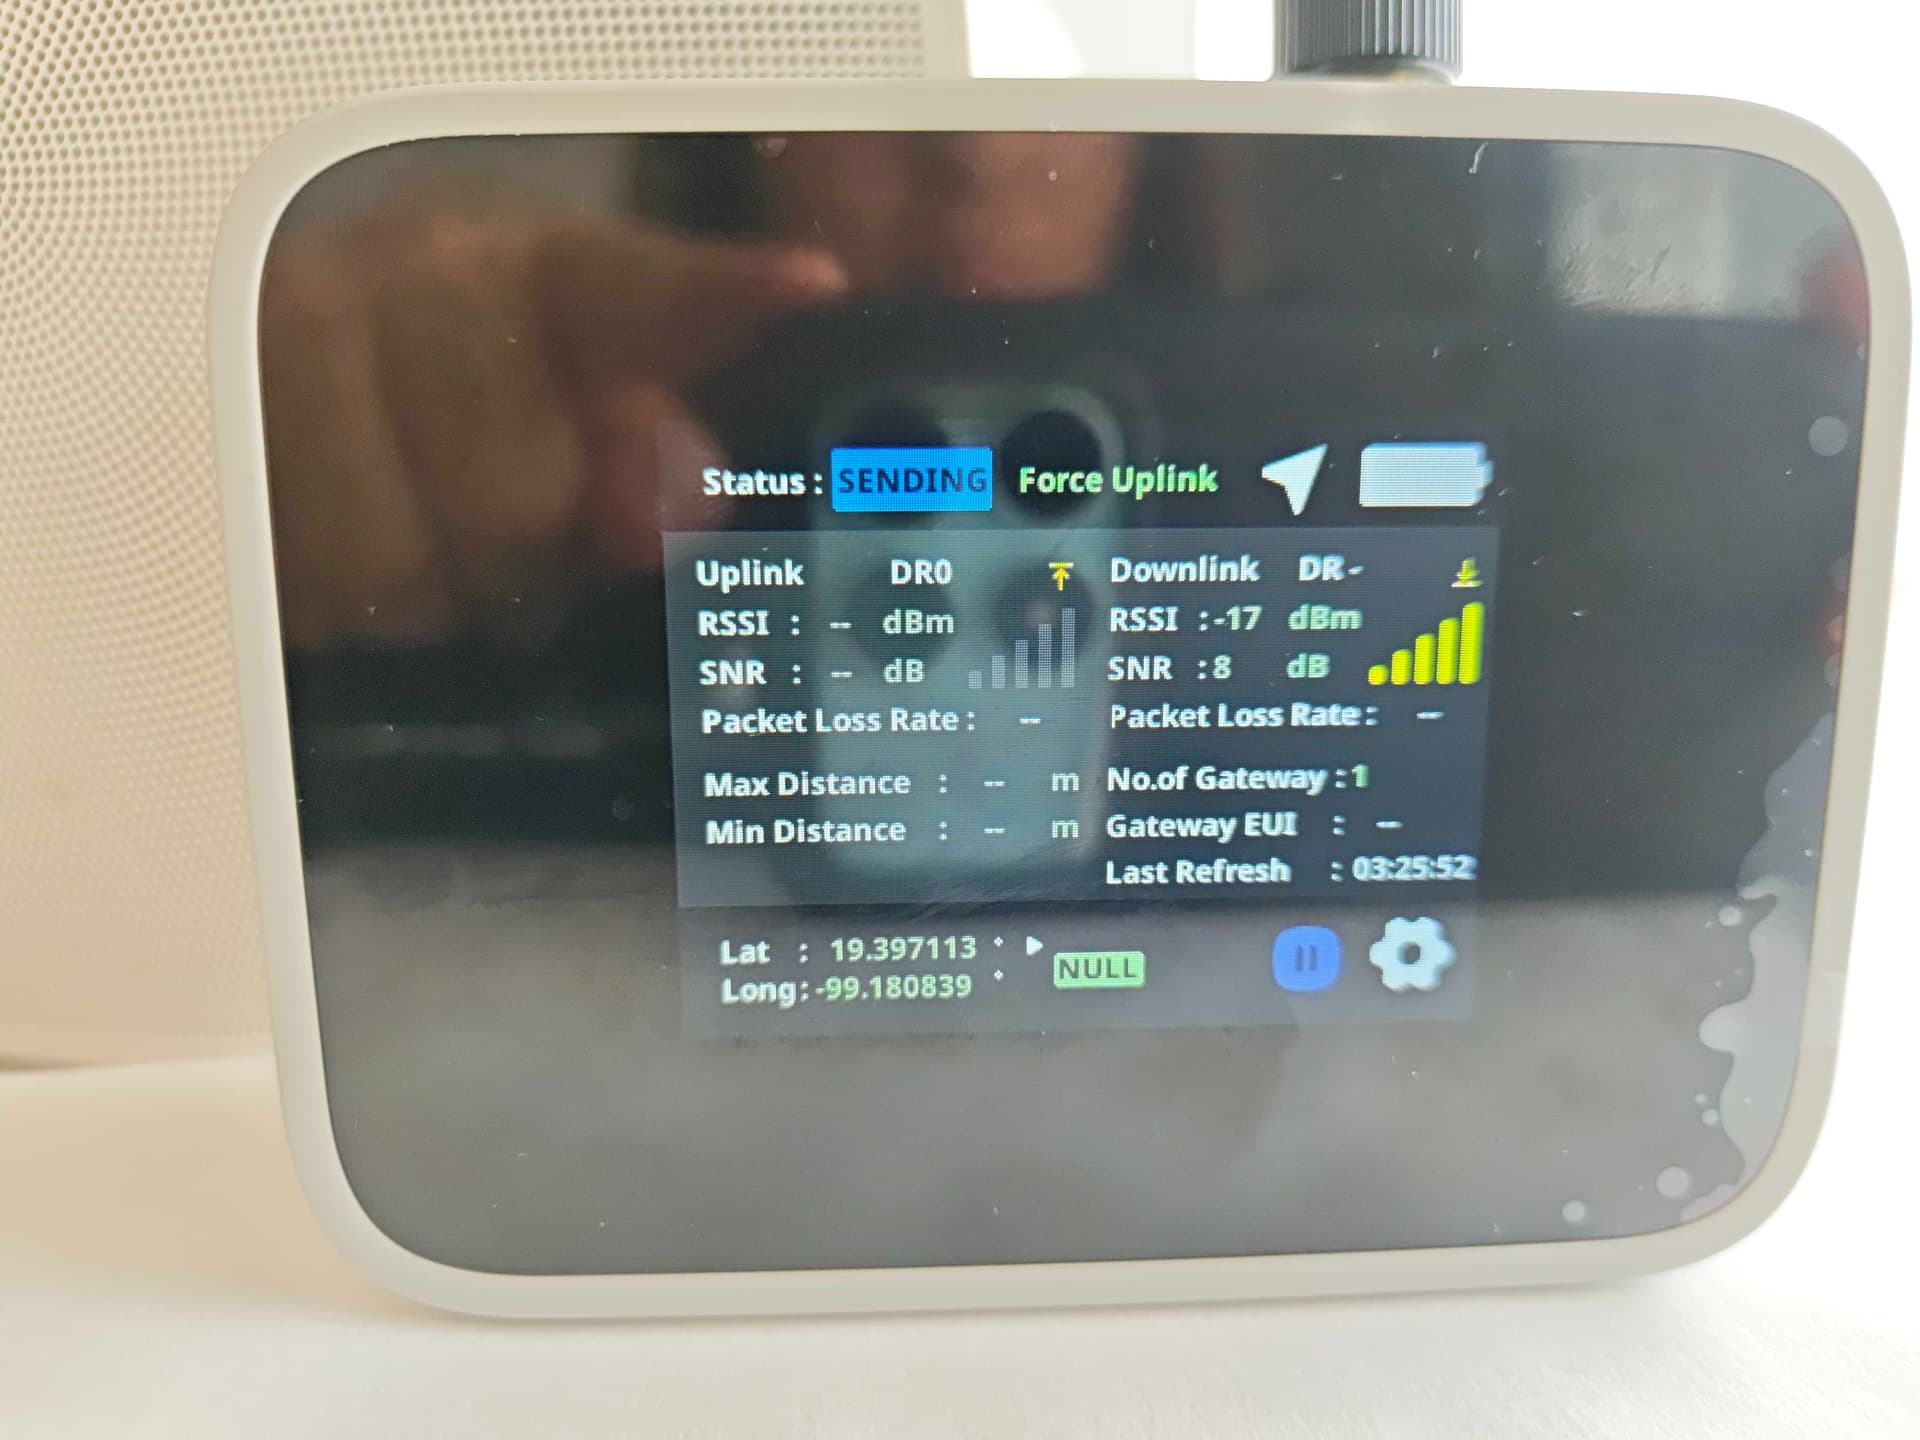
here are picture of the device and the LNS.

Hi @berlinenergielorawan ,

What you see on the screen is LinkCheck mode (RF downlinks only and Gateway count).

Since you do not have WisGate OS2 with the Field Data Processor extension running, you do not have the backend that can process the uplink and gateway metadata. The old -L and -P version has different implementation than the -Plus.

Alternatively, you can revert the FW to -L or -P FW and use the NodeRed backend that is already working on your setup.

There’s definitely a bug in the extension, and I was able to work around it and get the uplink data showing on the field tester.

Here’s my environment:

  • Edge Lite 2 unit, running firmware 2.3.1.
  • Field tester, running firmware 1.0.1.
  • Using the built-in LNS.
  • Installed the Field Test Data Processor extension v1.2.0
  • Have sent fPort 10 to the field tester.

The First Problem
Using packet capture for the registered end device, I can see the uplink and ACK messages for the field tester being logged, so that’s working fine.

Watching Mosquitto from an SSH session on the edge lite 2, (subscribe to the root topic ‘#’) I can see traffic publishing to the topic loranet/application/[appname]/device/[devID]/rx.

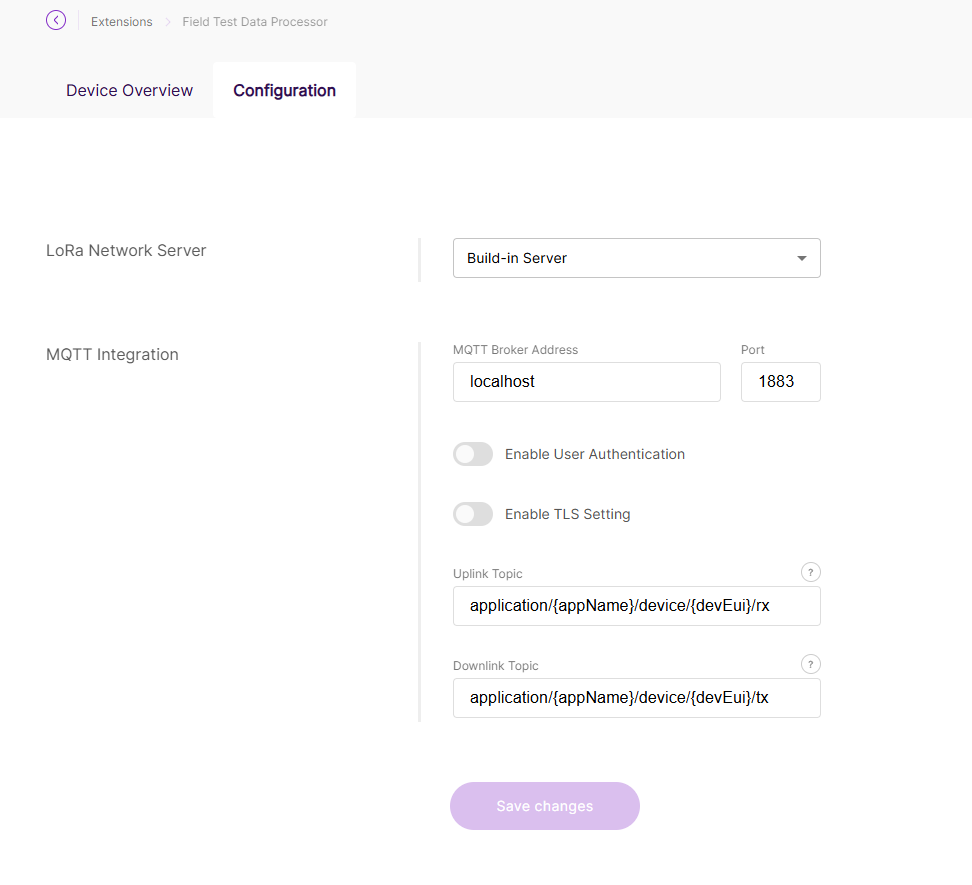
However, the extension configuration is by default subscribing to the topic application/[appname]/device/[devid]/rx.

You can find out which topic the Field Test Data Processor extension is subscribing to with logread | grep 'mapper' | tail -100 or similar. Just run that after starting the mapper service (i.e. /etc/init.d/com_rak_mapper stop and start).

When I start the extension I can confirm from logread that it’s subscribing to the wrong topic. This misalignment is the problem.

If I attempt to change the topic path in the extension’s configuration tab in the Gateway admin interface to add the loranet prefix (matching the topic the field tester is using), logread shows the extension doesn’t subscribe at all! I’ve tried multiple tests to modify the extension configuration to use different topics, and every time it would fall back to a regex wildcard with the prefix hardcoded to ‘application’:

Thu Aug 27 18:24:47 2026 user.info com_rak_mapper[24233]: RAK Field Tester Service v1.1.0
Thu Aug 27 18:24:47 2026 user.info com_rak_mapper[24233]: Starting mqtt client...
Thu Aug 27 18:24:47 2026 user.info com_rak_mapper[24233]: MQTT client connected
Thu Aug 27 18:24:47 2026 user.info com_rak_mapper[24233]: Uplink topic is => application/+/device/+/rx
Thu Aug 27 18:24:47 2026 user.info com_rak_mapper[24233]: Topic subscribed successfully

Solution Part 1
/etc/init.d/com_rak_mapper is running the /usr/bin/GW_field_test_v2.4.py script. Somewhere around line 569 in this file you’ll find where the uplink topic is set, and you can see that it hardcodes the root topic as application, even as a fallback. To fix this, just modify the regex to accept a loranet prefix and/or fall back to that. Basically something like this:

        topic_patterns = {
            'rak': (r'^(?:loranet/)?application/([0-9a-zA-Z+_-]+)/device/([0-9a-fA-F+]+)/rx$',
                    'loranet/application/+/device/+/rx'),

I suck at using vi, and nano isn’t on the gateway, so I just used scp to send the file local, modified it in VS Code, and used scp to send it back. Once I had modified it to use the loranet prefix, the extension started showing data in the “Data Overview” tab. Great success!!

So the extension is now working correctly. If you’re using an external LNS (e.g. chirp, ttn) you may be working already. If you’re using the built-in LNS, you probably still don’t have uplink data showing on the field tester.

The Second Problem
Even though the extension was showing data in the Device Overview tab of the gateway admin GUI, the field tester still didn’t show the uplink data on the unit. This seems to be because the field tester itself is rejecting packets that have zeros in the gateway’s GPS coordinates. You can find out if you’re affected by this problem by just watching the MQTT traffic from the gateway:

mosquitto_sub -h 127.0.0.1 -v -t 'application/#' -t 'loranet/application/#'

You’ll see envelopes coming through the loranet/…/rx topic with the gateway location. If the latitude and longitude fields are zeroes, that’s your problem. If the Field Tester itself doesn’t have GPS coordinates yet, it still works fine, it just won’t show distance from the gateway but it still shows the RSSI and SNR fields from the uplink data. If the gateway data doesn’t send location data, the field tester just dumps the messages and you’ll see nothing in the uplink column.

If you’re using the built-in LNS, this is a real problem because the configuration page doesn’t expose the fake GPS fields.

Solution Part 2
I changed the gateway mode to “packet forwarder” which does show the fake GPS fields, filled them in, and switched the mode back to “Build-in Server” (sic). The GPS data is retained and now the field tester shows the uplink data correctly, including distance to the gateway. If you’re using a different LNS, you may not have this issue but make sure that the GPS data is coming through by watching the MQTT traffic.

Conclusion
With both of these fixes in place, I was able to get the extension logging data and the uplink data showing on the field tester. I verified that this continued to work after rebooting both the gateway and the field tester.

As written, the Edge Lite 2 built-in LNS is not compatible with the field tester because the field tester is too strict about requiring gateway GPS coordinates and the EL2 doesn’t expose those fields to an admin to ensure they are set.

As written, the processor extension is incompatible with the field tester because they are publishing and subscribing to different MQTT topics.

The good news is that you can work around this.

  • Hope this workaround helps some of you
  • Hopefully the teams managing the gateway firmware, field tester firmware, and extension codebase do some better integration testing going forward.
Hi @leavesofsummer ,

I did try again on my WisGate and Field Tester.

With the settings mentioned on the documentation, I can successful capture the RF uplink parameters and works even without GPS.

Would you confirm that these are the exact steps you followed?

Built-in LNS and Fieldtester application - RAK10701-Plus Field Tester for LoRaWAN Network Setup and LNS Configuration Guide

Field Tester extension for Built-in LNS - WisGateOS 2 Manual | Customizable LoRaWAN Gateway Software

Regarding the first document, I did follow it, but since there’s some variability in options, I can specify that I chose the following:

  • On the gateway, I’m using the built-in LNS
  • For the field tester, I used the out-of-box DevEUI, AppEUI, and AppKEY (did not customize).
  • For the Lora application, I used Unified Application Key and Auto Add, and used the default AppKey and AppEUI values from the field tester.

There aren’t many options in the Field Tester extension instructions but I can confirm the out-of-box settings are what I used, specifically the MQTT values and host name and port.

I did not buy the gateway and the tester as a bundle, so the extension was not preinstalled, I installed it as a discrete step. I updated firmware on both the gateway and the field tester. I’m using the US915 band.

When I first set it up, I was getting values in the Downlink column on the tester, but nothing in the uplink, and the extension Data Overview tab would just show a spinning circle. I attempted to send the FPort 10 payload for manual activation, but that didn’t change behavior.

I found the issue by running mosquitto_sub -h 127.0.0.1 -p 1883 -v -t '#' to watch MQTT traffic, and saw that the actual uplink topic being used had the loranet prefix, but the extension (as one can see in its python script) does not allow modification to the topic outside very narrow confines, so it’s not correctable using the extension configuration.

After that was fixed, the tester wouldn’t show the uplink data until I added GPS coordinates to the gateway. I tried (too) many other ways to fix this - the natural suspicion was a similar problem in the MQTT topic, but that was a dead end. I just tried the GPS issue by chance since I felt I was at a dead end and once that info was there, the tester displayed the data immediately.

I suppose the question would be why my LNS is publishing with that loranet topic prefix and another would not be.

Possible reasons may include:

  • Different models of gateway.
  • If same gateway model, different firmware versions.
  • If same firmware versions, different Gateway Backend settings.
  • If same firmware versions, perhaps the presence/absence of existing lora application definitions.

I would think the loranet prefix would be pretty easy to track down and I suspect it’s in the LNS code/configuration - it’s coming from somewhere, and at least as far as I can tell is not something the user has control over. If you do a google search for the quoted term “loranet/application”, it seems this is a convention even on WisGate products, and I just don’t know enough about the systems to say whether the problem is in one product assuming the prefix (maybe after firmware change) or another product not assuming the prefix.

At a minimum, a small update to the extension to make it respect a custom topic value entered by the admin user in the extension configuration would let the user work around this issue without having to ssh into the gateway and edit python code. Also, a small change to the wisgate firmware to expose the fake GPS fields for the built-in LNS would be good - I mean, why not expose that customization layer?