LoRaWan Stack: DR-LWS-003
Frequency Band: EU868
DevEui= A8 40 41 00 01 81 DC 05
Enter Password to Active AT Commands
JOINED
[953]***** UpLinkCounter= 0 *****
[954]TX on freq 868300000 Hz at DR 0
[2440]txDone
[3470]RX on freq 868300000 Hz at DR 0
[3670]rxTimeOut
[4435]RX on freq 869525000 Hz at DR 3
[4475]rxTimeOut
[48372]***** UpLinkCounter= 1 *****
[48373]TX on freq 867700000 Hz at DR 0
[49859]txDone
[50889]RX on freq 867700000 Hz at DR 0
[51089]rxTimeOut
[51854]RX on freq 869525000 Hz at DR 3
[51894]rxTimeOut
[60953]***** UpLinkCounter= 2 *****
[60954]TX on freq 867900000 Hz at DR 0
[62441]txDone
[63471]RX on freq 867900000 Hz at DR 0
[63671]rxTimeOut
[64436]RX on freq 869525000 Hz at DR 3
[64476]rxTimeOut
[120953]***** UpLinkCounter= 3 *****
[120954]TX on freq 867500000 Hz at DR 0
[122441]txDone
[123471]RX on freq 867500000 Hz at DR 0
[123671]rxTimeOut
[124436]RX on freq 869525000 Hz at DR 3
[124476]rxTimeOut
[180953]***** UpLinkCounter= 4 *****
[180954]TX on freq 867700000 Hz at DR 0
[182441]txDone
[183471]RX on freq 867700000 Hz at DR 0
[183671]rxTimeOut
[184436]RX on freq 869525000 Hz at DR 3
[184476]rxTimeOut
[240953]***** UpLinkCounter= 5 *****
[240954]TX on freq 867100000 Hz at DR 0
[242441]txDone
[243471]RX on freq 867100000 Hz at DR 0
[243671]rxTimeOut
[244436]RX on freq 869525000 Hz at DR 3
[244476]rxTimeOut
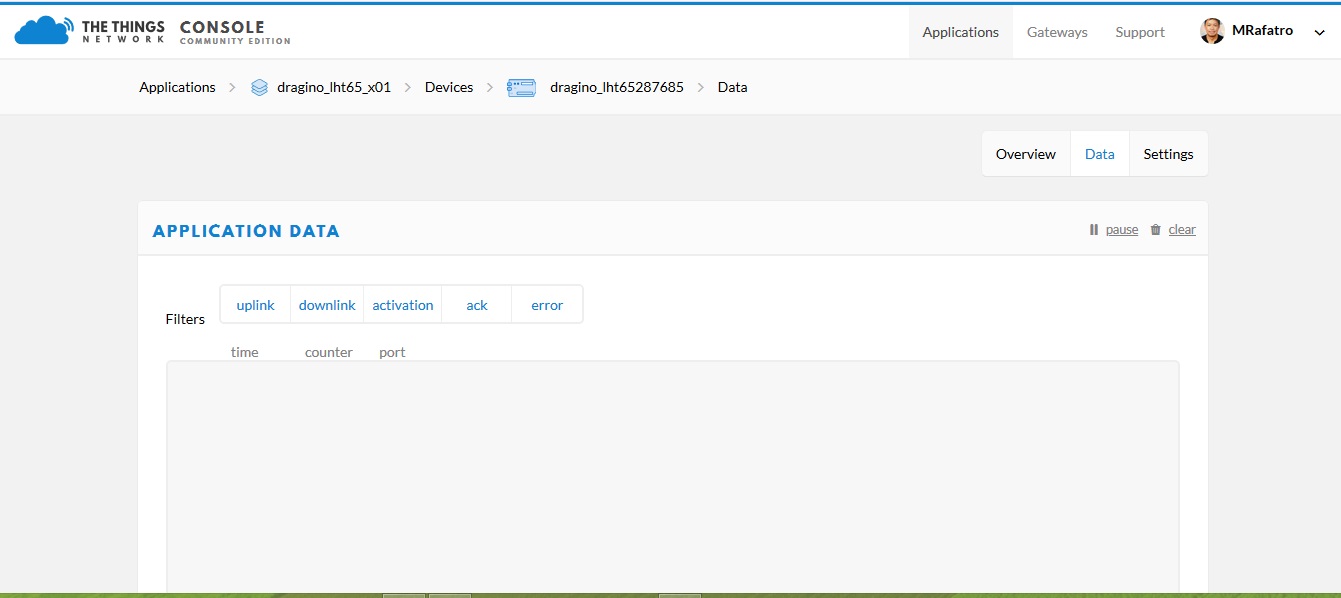
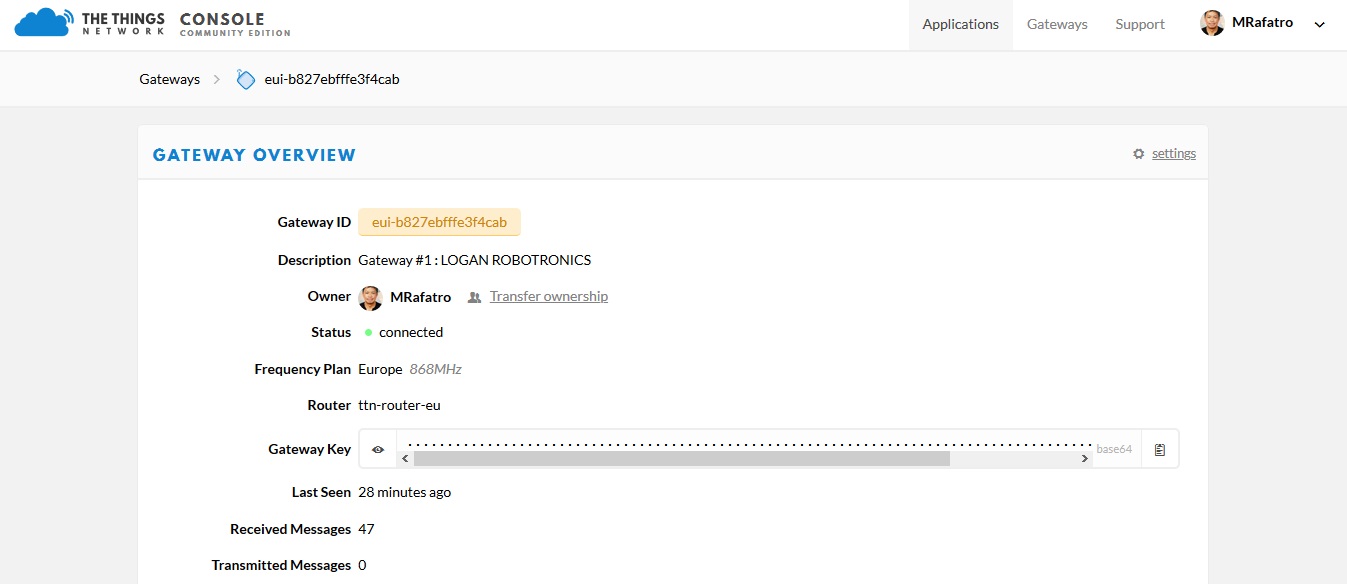
This is more a TTN question - as you say, the gateway is showing connected.
The data / traffic pages only show entries as they happen - they do not show historic data* and if you navigate away from the page for long enough or log out, it will be blank again when you go back.
If you have the FREE data storage integration turned on, it will pickup a few lines of historic data, bit random as to how many entries it shows.
So, add the data storage integration so you can start saving your data, go to the data page so you can see it and then get your Dragino device to send an uplink.
You can also have the traffic page open for the gateway - same rules, you only see it as it comes in.
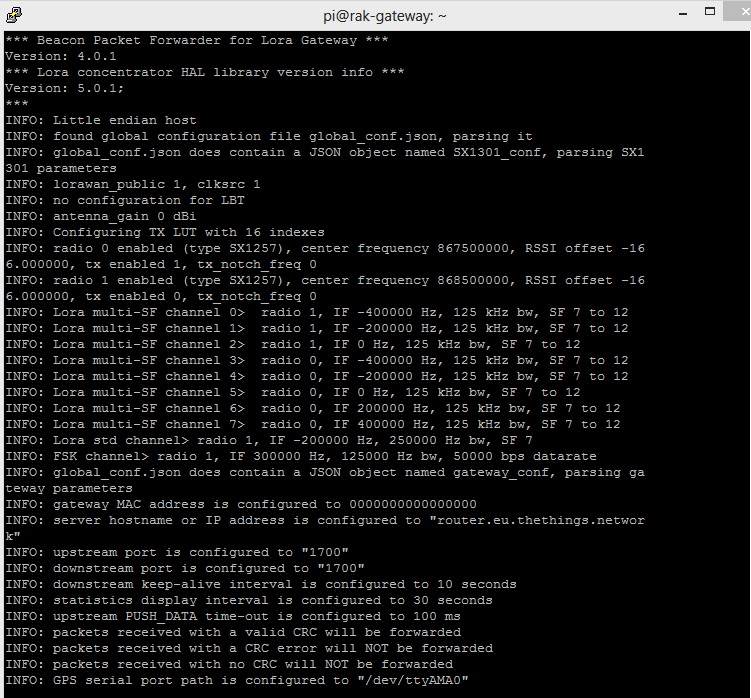
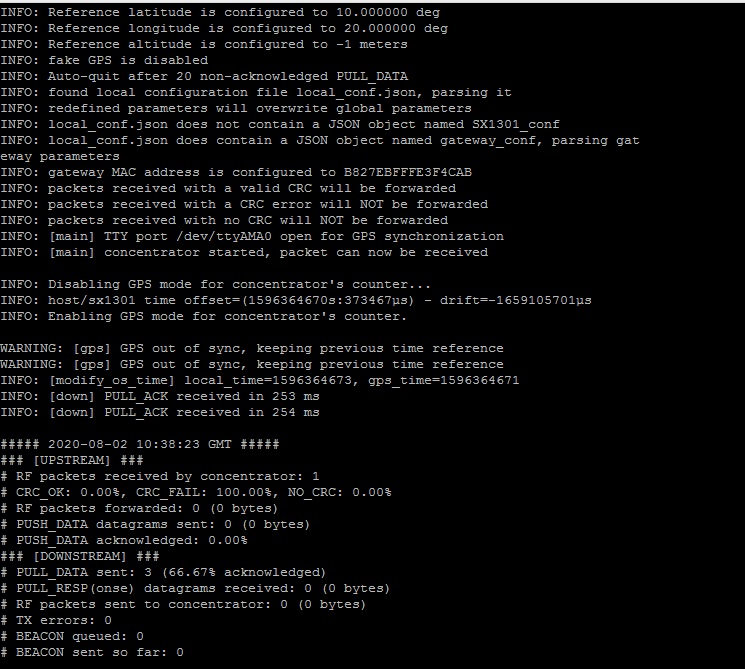
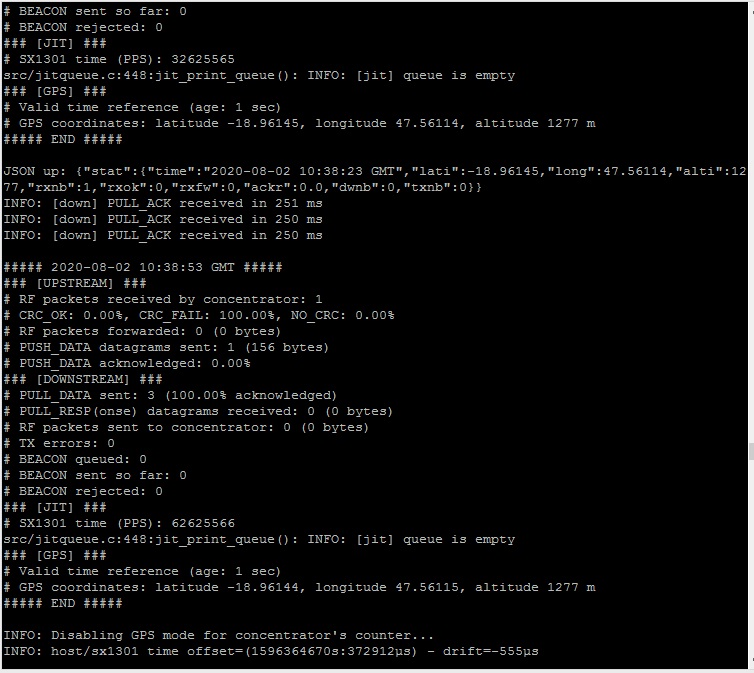
Your packet forwader logs indicate you are getting CRC error packets, but not in that instant any valid ones.
Watch the packet forwarder logs longer; if you only see CRC error you need to figure out why. One the other hand, if you are getting valid packets at the concentrator, then the CRC errors are probably due to non-LoRa traffic falsely tripping the start of packet detection.
It may be premature to look at “data integration” or similar until you know that the gateway is receiving valid LoRa packets, as valid LoRaWAN packets can only be contained in valid LoRa ones, and so far your logs show only LoRa packets which have errors.
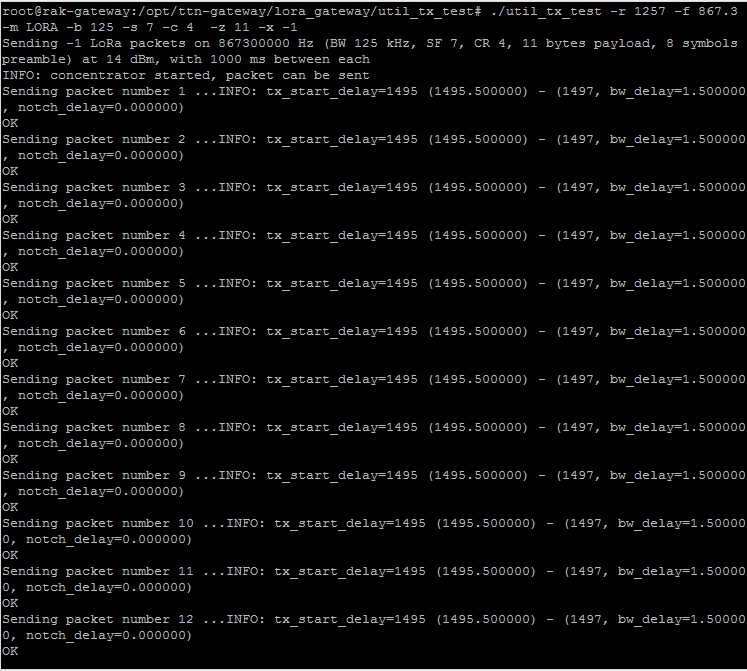
I’d first try to figure out if they are time correlated to your transmission attempts.
I believe you can modify the packet forwarder configuration file, or failing that the source code itself to pass on (and potentially print) packets with errors, then you could see if they bear any resemblance to what you were sending, in terms for frequency, SF, or timing (remember the raw packet will be encrypted, not the cleartext application one)
Also try to get several meters distance between the node and gateway; being too close can cause false reception on other channels, and possibly in an extreme case only garbled reception without any good reception on the true channel.
Look at this part of the code and try the json key that would control it, also consider modifyin the source to print out more in the log in the case it controls:
Hi all
I think of something that could be the cause of the problem There are a lot of 890MHz GSM2 transmitter next to us Can be interference that alter the lorawan signal