TL;DR: On RAK3172-E in P2P mode, after sustained AT+PSEND traffic
the AT command processor stops responding on UART1 (PB6/PB7) — but
only when AT is on UART1. Same module on USART2 (PA2/PA3, the
CH340/USB path) is unaffected. URC events keep flowing on the wedged
UART, only AT command input is dead. Hardware RESET is the only recovery.
Have a Python reproducer + 4-hour soak data. Looking for confirmation it’s
a known issue and any guidance on workarounds beyond hardware reset.
Setup
- Module: RAK3172-E (WisDuo, STM32WLE5CCU6, iPEX antenna)
- Carrier: RAK3172-E Evaluation Board, USB-powered from a Pi 4
- Firmware: RUI3 from
rak_rui:stm32BSP (Arduino sketch), confirmed
on 4.1.0, 4.2.3, and 4.2.4 — all wedge on UART1 - Mode:
AT+NWM=0, US915, SF10, BW 125 kHz, CR 4/5, 20 dBm - Workload: Two-node mesh, ~6 ft apart, real IP-over-LoRa traffic at
~0.07 Hz mean rate (one packet every 14s) — well below any documented
envelope
Symptom
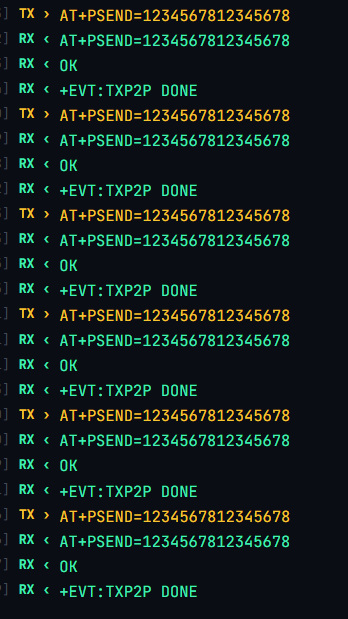
Last commands before wedge (all OK, ~50–300ms latency):
AT+PSEND=AB12CD... → OK (180ms)
AT+PSEND=89F4...   → OK (220ms)
AT+PSEND=DEAD...   → OK (190ms)
AT+PSEND=BEEF...   → AT_TIMEOUT (3000ms+)  ← wedge starts
Post-wedge (all silent, no response within 3s):
AT          → no response
AT+VER=?    → no response
AT+RESET    → no response
ATZ         → no response
URC events continue normally on the same UART:
+EVT:RXP2P:-35:8:0100010002...
+EVT:RXP2P:-34:9:030001FFFF...
This pattern — output works, AT command input is dead — strongly
suggests a state-machine / buffer issue specifically in the AT command
parser, not a chip-wide failure. Soft recovery (port close+reopen,
AT+RESET, ATZ) does not work; only NRST pulse / RESET button / USB
power cycle clears it.
What we’ve ruled out
- Pi/host side: independent Python AT probes (separate process, same
UART) also see no response. ModemManager masked.lsofconfirms only
one process on the device. - Dual-AT contention: putting USB UART in
RAK_CUSTOM_MODEto take
it out of the CLI dispatcher does not fix the wedge. Bug occurs even
with single AT-mode UART. - TX rate: wedges occur at sub-1 Hz rates (one TX every 14s).
Slowing to 30s+ doesn’t eliminate it. - Specific module: swapped modules between hosts; bug follows the
firmware, not the silicon.
The discriminator: which UART carries AT
| AT carried on | 4-hour soak result |
|---|---|
| USART2 (PA2/PA3) | 0 wedges |
| UART1 (PB6/PB7) | 1,179 wedges, ~6/min steady-state |
This may point to a UART1-specific code path in the RUI CLI dispatcher
or serial driver. Pattern across runs: 0 to ~40 minute warmup window,
then steady-state ~6 wedges/min until reset.
Operational impact
Real two-node mesh, 4-hour run, 329 application messages originated:
- 50 ACKs received from peer
- 52 messages delivered to peer’s app layer
- ~84% loss rate even with retry/backoff/5-failure circuit breaker
Reproducer
Standalone Python script (~12 KB, requires pyserial only). Triggers
the wedge reliably and writes /tmp/rak-wedge-<ts>.jsonl with every
AT command + response + latency, plus a summary of the last 200
commands before the wedge. Happy to share — let me know best way.
Asks
- Is this a known issue in your tracker? Commit/release it might be
fixed in? - Any soft-recovery workaround we’ve missed?
- Does the UART1 vs USART2 split match anything you’d expect from the
driver code?
We can provide additional logs, the reproducer script, soak run data,
or test patched firmware if helpful.
Thanks!