I am having a heck of a lot of trouble getting my RAK3172 to function properly, and I am stuck. I am currently using the RAK3172 Evaluation Board as bought from RAK, with headers soldered on for I2C and SWD. I was attempting to diagnose a bug a using the ST-Link v2, however for some reason I can now not even get the chip to function at all. I attempted to flash the chip with the .hex file and the .elf file (for debugging), and they all upload correctly, however immediately the CPU locks up, and when trying to see the faults I get the error “Could not read the SP Register”. For some reason when I flash the .bin file, every once in a while, it works for a little bit, but then locks up again upon a reset.
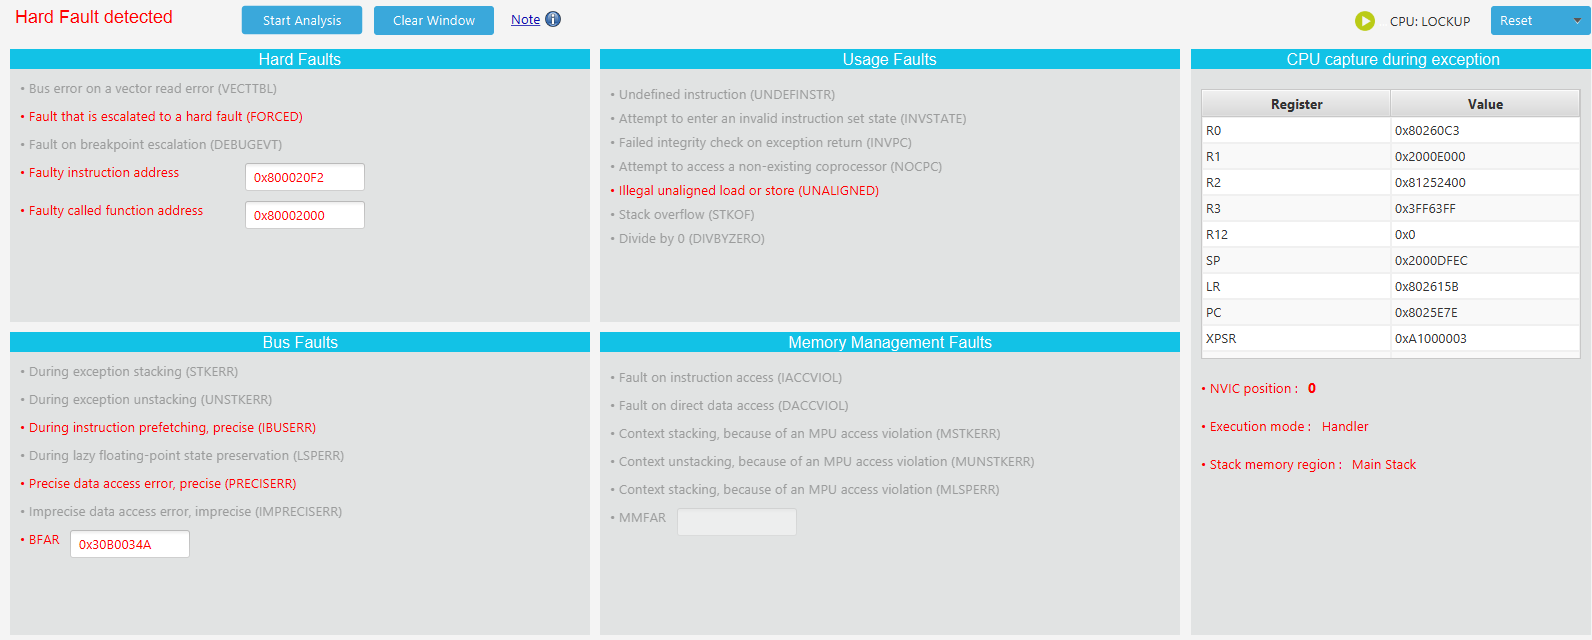
The upside to the .bin file, however, is that the hard fault analyzer finds this, which is mildly confusing because I thought the elf file is the one with the debug information:
I’ve been pouring through STM32 documentation, memory maps, register values, etc. but I cannot figure out what is causing this issue. This happens on two different evaluation boards purchased at different times, so unless I am super unlucky, I don’t think the chips are bricked.
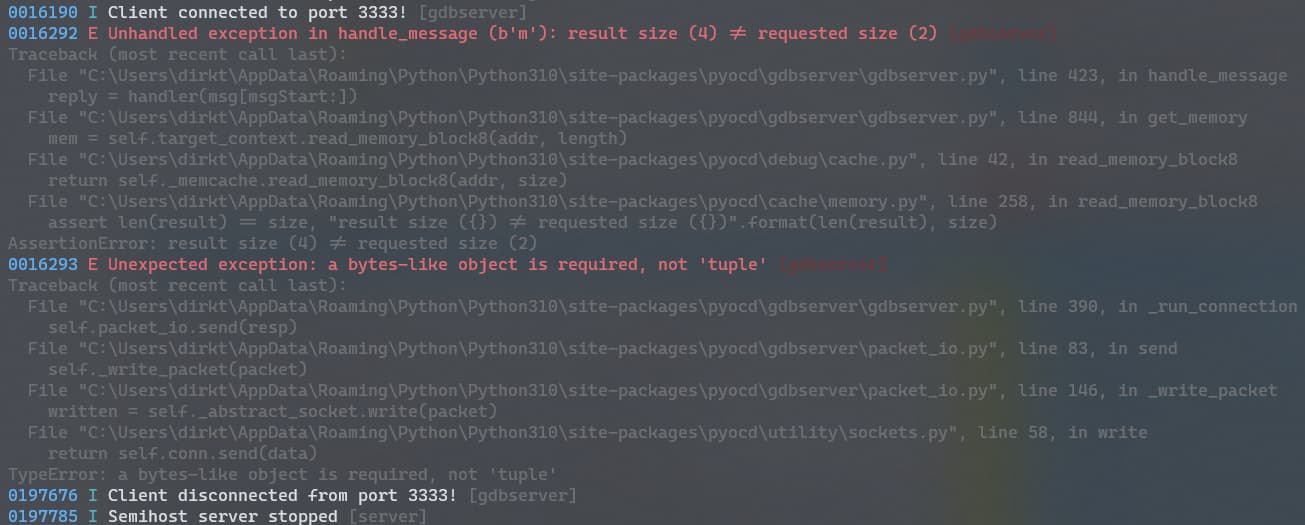
I also tried using pyOCD to flash the file and maybe open it through gdb before it locks up to see the offending line of code, however with that all I get is the following error which I will add in a separate post as I am a new user.
I believe this has something to do with the fact that it is hard faulting, as when I ran in gdb “set remote debug 1” it returned a packet with the words hard fault in the text.
you didn’t say which files you are trying to flash. so i recommend to flash the original bin or hex files from here: choose the E version and see what happens…
Thank you for your response. I flashed this file and the RAK3172 is no longer locked up, however I am not 100% sure of what this file does so I am just assuming it is working. I was also able to attach to the process in the debugger, however it didn’t really do anything because again, I don’t have the code.
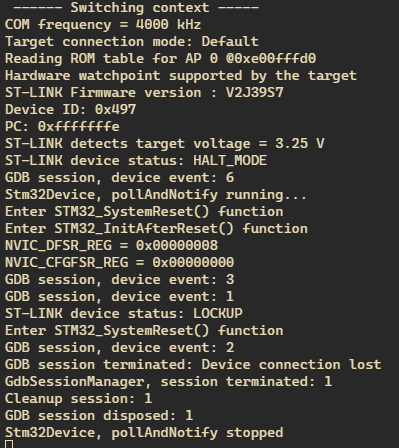
I attempted to reflash my own code I wrote through the Arduino extension on VSCode, which is what I was using before, and that is still locking up the CPU, and this happens anytime I flash any Arduino related project, which again, did not happen until recently. When attempting to jump in with the debugger, I notice it is giving me something to work with, which is shown below:
The NVIC_DFSR_REG is reporting 8, which according to the ARM developer website is a “precise external abort”, and I am not too sure what that would correspond to. I tried some googling, however I could not find anything specific to look at.
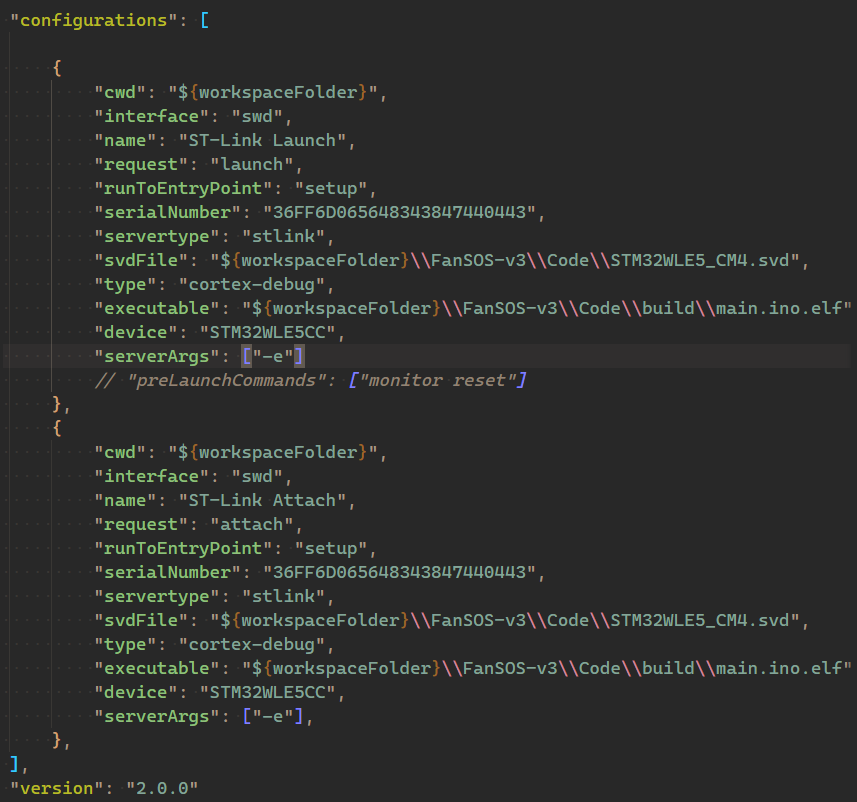
Here is a picture of my launch.json file to start the debugging process:
Like I said before, the weird part is that this works like 1 out of every 100 runs, but as soon as it hits a call to sleep in the code it seems to break again.
That file is the official RUI3 which can help writing your Arduino compatible firmware through Rak API that will help not fall into the kind of issue you are running into. wi would recommend to consult the docs here to get an idea of the API.
now with that said, and given your answer above, it is obvious that the issue is somewhere in your source code and without having that at hand it’s hard for any of us to help you. so my suggestions are as follow:
invest a little time to learn how to use RUI3 and rewrite your firmware using their API.
break down your code by starting a new project and gradually move pieces of your code until you find an issue.
share your code so we can try and help identify the issue.
one thing to look into maybe you have a race condition somewhere that causes your code to lock up, so if you are using interrupts you might want to flag your concerned variable as volatile and disable interrupts when updating them outside of the ISR or wrap it inside a critical section …
Thank you again for your help, and I apologize for not posting code, however it is proprietary, so I try to avoid sharing too much online. Unfortunately, I think my issue is beyond my code, however.
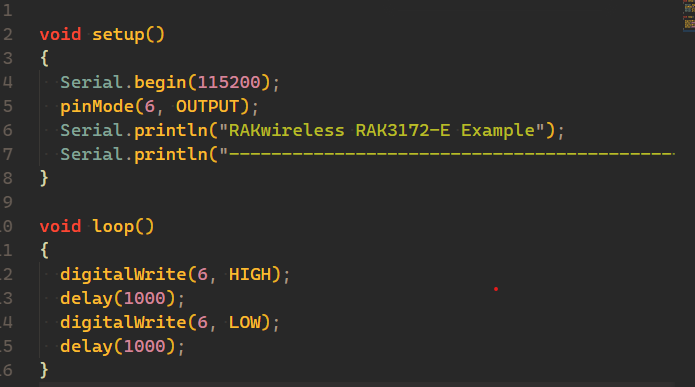
I took your advice, and I opened up the RAK3172-E example in Arduino, and added a blinking LED to it as well, shown here:
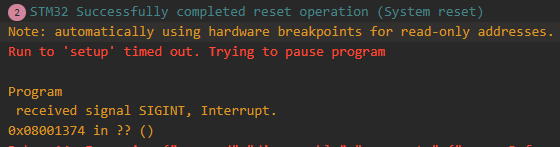
I then compile the code using CTRL+SHIFT+R or Arduino:Verify in the context menu. It compiles fine, then I run my debugger to upload the code to the device and then attempt to step through it. When I do that, it uploads fine, however when it should be running to the setup function and stopping, it does this instead:
When it does this, instead of going into any source code, it spits out a huge page of Disassembly and as it shows in the picture, doesn’t even know where it is. Using the “debuggerArgs” command I provided the location to the source file directly and when I run “info breakpoints” in the debug console it shows me the breakpoint for the setup function, however I believe it doesn’t even get there as that breakpoint is never reached. Running “info source” states “No current source file.” At this point if I continue debugging it loops through the assembly a few times then resets the connection which disconnects GDB. I don’t think it even reaches the code.
Like I stated earlier, I’ve tried this on two separate evaluation boards, which did not even get this far, they just locked up. I am now trying on a custom board which I made for our project, and while that one does not lockup, instead it just does what I described above.