Issue: I am sending out a single packet and almost every time I get an additional 1,2, or 3 packets which show up as errors because it says the count didn’t increase
Setup: A RAK7246 running the chirpstack OS and acting as its own server. The end point devices are custom RN2903 boards.
Server: The RAK7246
Details:
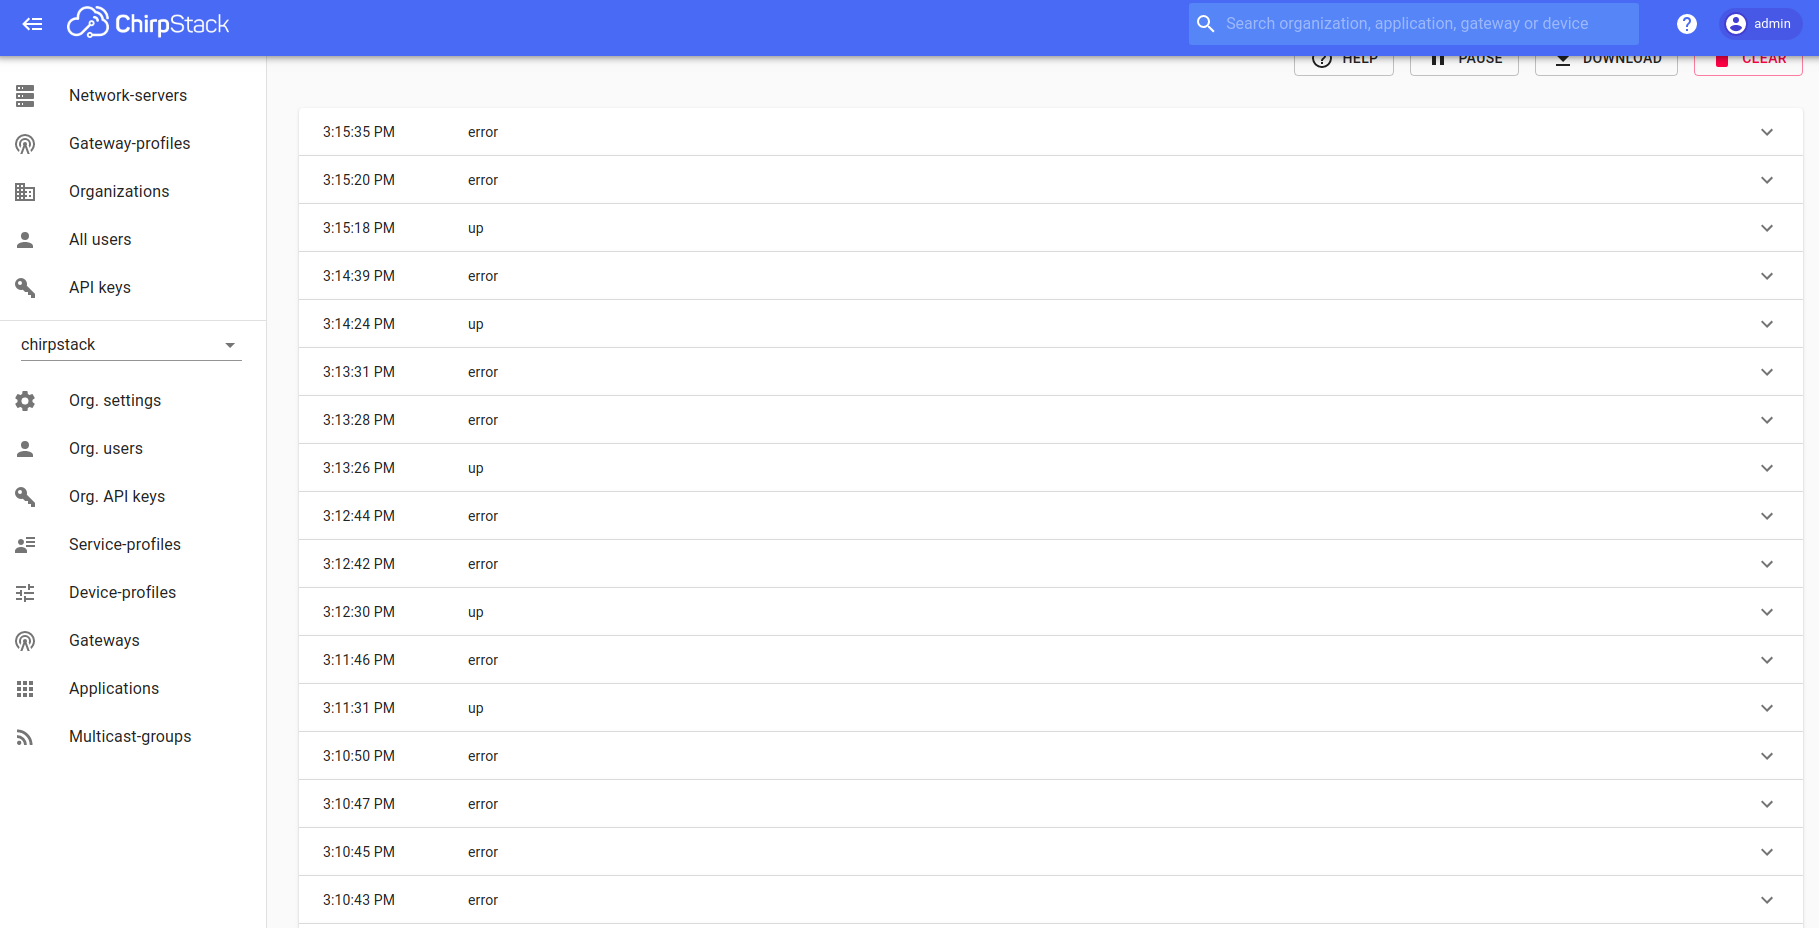
The “Issue” section above pretty much sums it up. You can kind of see what it looks like here:
Any idea why it would be thinking there are multiple packets? I am sending out a single unconfirmed uplink, so I don’t know why it thinks there are others.
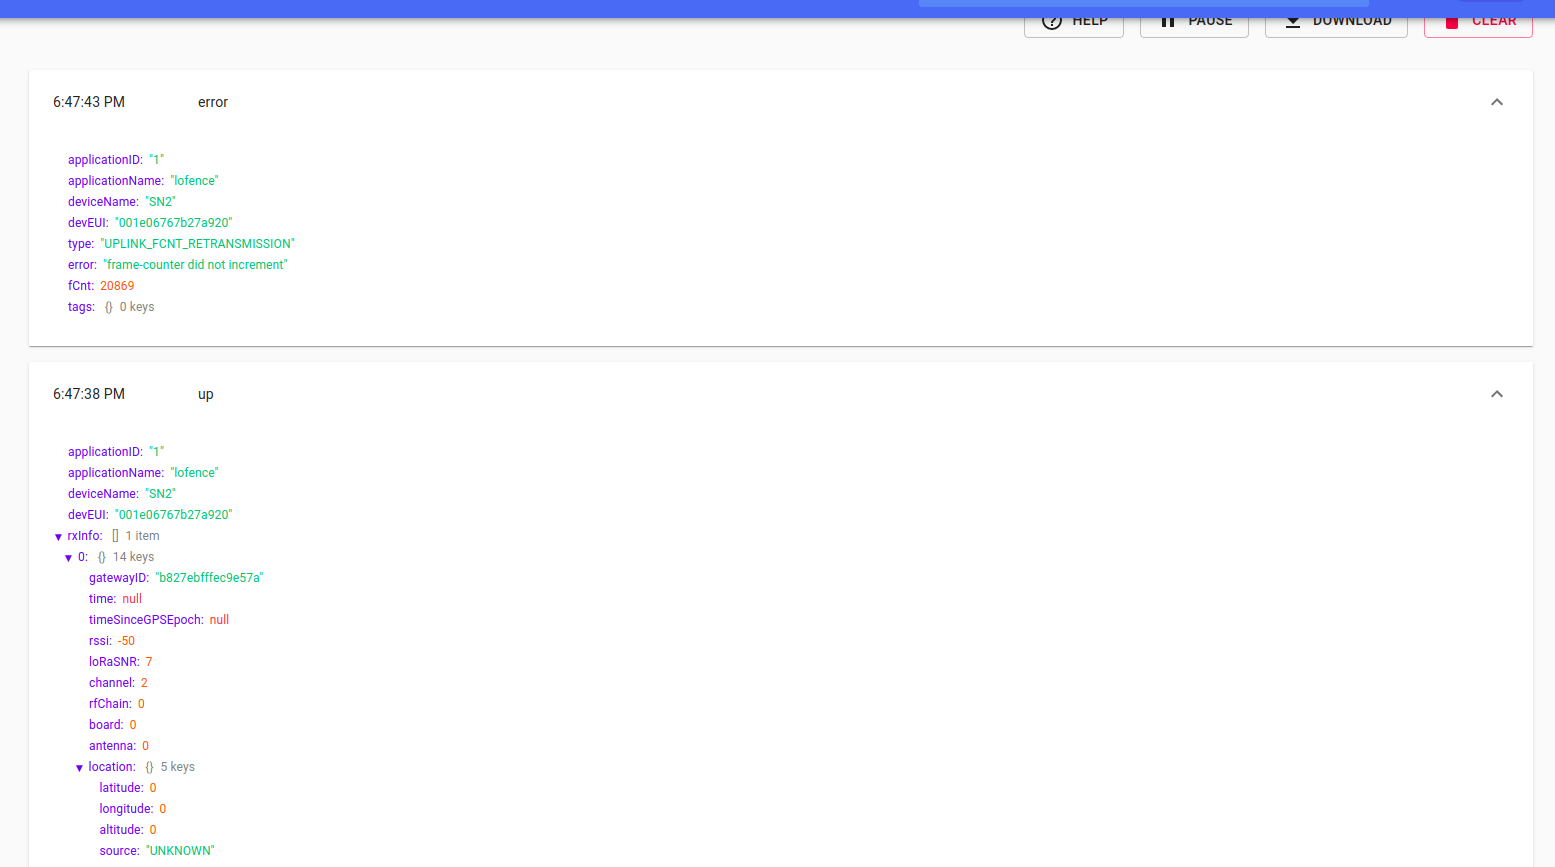
Some detail on the errors would be useful - it’s typical to be able to see the Device Address which may reveal that your gateway is receiving radio signals from other nodes which, either because they aren’t in LoRaWAN format and almost certainly because they are not registered with your NS, cause an error.
You are right of course . Let me also give you a little more info. I have the Gateway on the top floor of my house and the end node in the basement. I am in the US, so I am operating in the 915MHz range. I only have a single end node on at the moment.
She was being a fickle lady and wasn’t much help which is why I ended up here (though my google skills might have been off off-kilter again…).
That said, I managed to have great overnight tests. In my code for the RN2903 I set pwridx to 5, which based on Microchip’s documentation, that is 20dBm. This is a bit loud, but my real tests are outside, so I’ll want that oomf. Last night I decided to set pwridx to 10, which should be 10dBm and I only had 13 of the errors over an 8 hour period.
I had wondered if maybe the signal was too loud and I was ending up with some slop in adjacent channels making it look like I transmitted twice, but I thought it unlikely because the reported channels of the errors weren’t adjacent (at least consistently) to the actually transmitted channel. I am re-thinking that based on last night’s test, but am not 100% sold yet.
The interesting thing to me is that the RSSI and LoRaSNR values aren’t terribly different between the two tests. They both seems within the range of possibility (of course both are reasonably high values), I just would have expected the values when pwridx was set to 5 would have shown more of a saturation. Who knows…
You are referring to the uplink framecount re-transmission, right?
Yes, that was what I was looking into. I am only sending the one transmission, so I don’t know why it sometimes sees that. I am doing unconfirmed, so I know that it shouldn’t be re-transmitting on its own, so that was why mentioned that I suspected overpowering the front-end and maybe it was causing some inadvertent signal recovery (that wasn’t actually there) in other channels.
This is indeed something that happens when the receiver front end is overloaded.
The key would be that the duplicate packets would have different frequency but almost identical timestamps, as they are the same transmission. The duplicates are also likely to have much weaker RSSI, and some may have CRC errors (typically a packet forwarder will only log or count CRC error packets locally and not pass them to the network server, though that is configurable)
Wheras a re-transmission due to something like a missed confirmed uplink ACK (which you pointed out you were not using) or even a node firmware bug would have to be at least a message duration different in time stamp, ie, tens to hundreds of milliseconds later, often multiple seconds as an actual retry would not occur until both receive windows had passed.
And see, this is where I confused myself. Because I would have expected the times to be within a second for an overloaded front end, but some of these errors could be as much as 5ish seconds from the original message (at least as reported by the web browser). Plus, I would have expected the splashover to be the first adjacent channel, but sometimes it was more than a channel over without the channel in between being “active.”
You should SSH into the pi and look at the raw packet forwarder log, specifically the hardware timestamp which is a rolling 32-bit counter. Or else look at the raw gateway traffic view in chirpstack
If there are really multiple seconds between these packets (as indeed, your first screenshot appears to show) and that is confirmed at the level of raw concentrator counter timestamps, then it’s not a gateway or server problem, it’s a case of the node re-transmitting. If you’re not using confirmed uplink, then you have a node firmware bug.
That’s not necessarily proof that overloading did not occur.
However, the apparent difference in timestamps would be.
Where does this log get written to? It seems like almost everything goes to /var/log/messages (which can be a mess to debug through. I am wondering if I need to change a log level value somewhere (they are all set to default).
I am guessing that what you are looking for is the same hardware timestamp in both packets? That would indicate that it is truly the same single transmission multiple times?
quick edit
And of course I roll back my node to use the older pwridx value (that was causing me issues) and it hasn’t caused any problems in the last 30 mins… I’ll keep it running and hope I can get one of the errors and can see what the values say.
Are you sure it is only actually transmitting once? You may only be giving one request to the module, but do you know it has not decided on its own to retry for some reason?
In terms of the packet forwarder logs, trying using grep on them to find actual receive events