
Attempted to connect, TTGO LORA32 end node to RAK7391 gateway following example as a base, using OTAA connection. Noted that No JoinAccept message occured at end node, checked gateway logs and noted that downlink appeared to occur but apparently did not, as looking into udp-packet forwarder container log noted that no bytes were sent to the concentrator. I am really new to this so please advise on how to get downlink to work.
Rakpios version: rakpios-0.7.0
##### 2023-06-01 08:32:53 GMT #####
### [UPSTREAM] ###
# RF packets received by concentrator: 0
# CRC_OK: 0.00%, CRC_FAIL: 0.00%, NO_CRC: 0.00%
# RF packets forwarded: 0 (0 bytes)
# PUSH_DATA datagrams sent: 1 (123 bytes)
# PUSH_DATA acknowledged: 0.00%
### [DOWNSTREAM] ###
# PULL_DATA sent: 3 (0.00% acknowledged)
# PULL_RESP(onse) datagrams received: 0 (0 bytes)
# RF packets sent to concentrator: 0 (0 bytes)
# TX errors: 0
### SX1302 Status ###
# SX1302 counter (INST): 2158505242
# SX1302 counter (PPS):  0
# BEACON queued: 0
# BEACON sent so far: 0
# BEACON rejected: 0
### [JIT] ###
src/jitqueue.c:440:jit_print_queue(): INFO: [jit] queue is empty
#--------
src/jitqueue.c:440:jit_print_queue(): INFO: [jit] queue is empty
### [GPS] ###
# Invalid time reference (age: 1685608373 sec)
# no valid GPS coordinates available yet
##### END #####

JSON up: {"stat":{"time":"2023-06-01 08:32:53 GMT","rxnb":0,"rxok":0,"rxfw":0,"ackr":0.0,"dwnb":0,"txnb":0,"temp":51.3}}
SPECTRAL SCAN - 923600000 Hz: 0 0 0 0 0 0 0 0 0 0 0 0 0 0 0 0 0 0 0 0 0 0 848 1152 0 0 0 0 0 0 0 0 0

INFO: Received pkt from mote: 4E8AB923 (fcnt=42092)

JSON up: {"rxpk":[{"jver":1,"tmst":2171880478,"chan":1,"rfch":0,"freq":923.400000,"mid": 8,"stat":1,"modu":"LORA","datr":"SF10BW125","codr":"4/5","rssis":-81,"lsnr":13.2,"foff":-9608,"rssi":-80,"size":23,"data":"ACO5ik4ubKS40Lf9XL4aLOoxL12Octk="}]}
SPECTRAL SCAN - 923800000 Hz: 0 0 0 0 0 0 0 0 0 0 0 0 0 0 0 0 0 0 0 0 0 17 1089 859 35 0 0 0 0 0 0 0 0
SPECTRAL SCAN - 924000000 Hz: 0 0 0 0 0 0 0 0 0 0 0 0 0 0 0 0 0 0 0 0 0 17 1211 361 411 0 0 0 0 0 0 0 0

##### 2023-06-01 08:33:23 GMT #####
### [UPSTREAM] ###
# RF packets received by concentrator: 1
# CRC_OK: 100.00%, CRC_FAIL: 0.00%, NO_CRC: 0.00%
# RF packets forwarded: 1 (23 bytes)
# PUSH_DATA datagrams sent: 2 (374 bytes)
# PUSH_DATA acknowledged: 0.00%
### [DOWNSTREAM] ###
# PULL_DATA sent: 3 (0.00% acknowledged)
# PULL_RESP(onse) datagrams received: 0 (0 bytes)
# RF packets sent to concentrator: 0 (0 bytes)
# TX errors: 0
### SX1302 Status ###
# SX1302 counter (INST): 2188518068
# SX1302 counter (PPS):  0
# BEACON queued: 0
# BEACON sent so far: 0
# BEACON rejected: 0
### [JIT] ###
src/jitqueue.c:440:jit_print_queue(): INFO: [jit] queue is empty
#--------
src/jitqueue.c:440:jit_print_queue(): INFO: [jit] queue is empty
### [GPS] ###
# Invalid time reference (age: 1685608403 sec)
# no valid GPS coordinates available yet
##### END #####
udp packet forwarder log
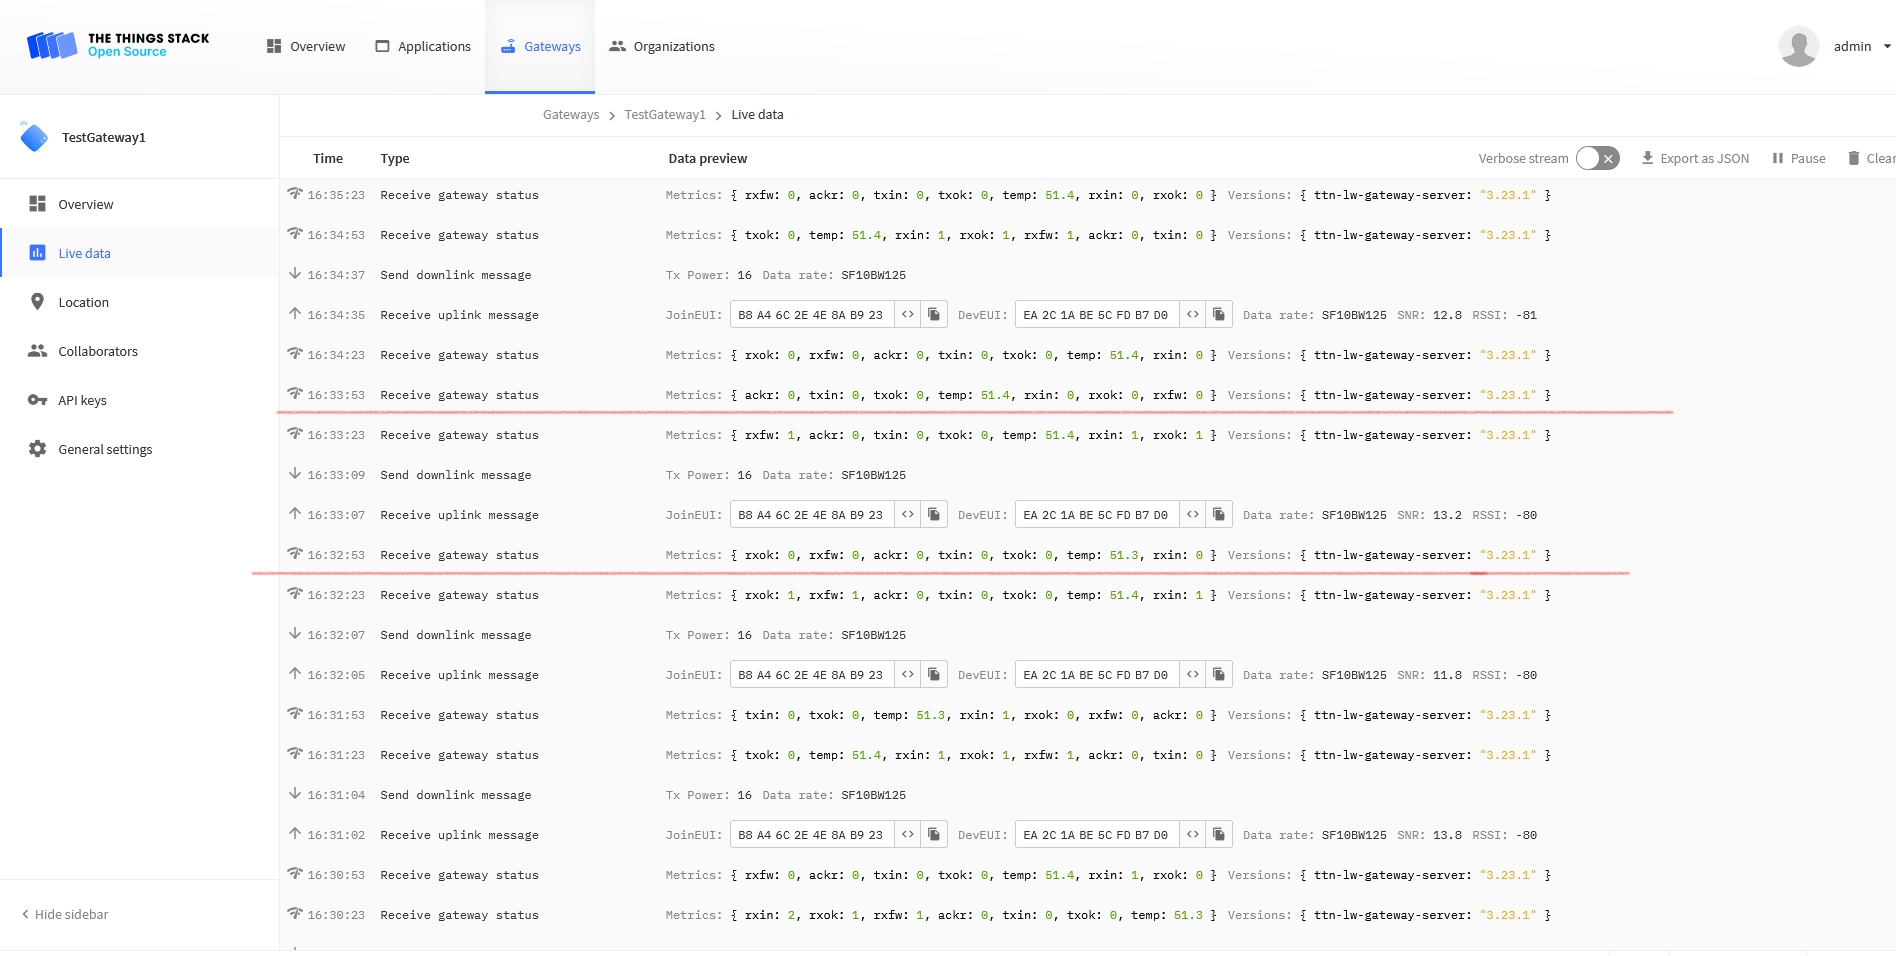
Things network Live data
version: '2'

services:

  udp-packet-forwarder:
    image: rakwireless/udp-packet-forwarder:latest
    container_name: udp-packet-forwarder
    restart: unless-stopped
    networks:
      - bridge
    devices:
      - /dev/gpiochip0
      - /dev/ttyACM0
      - /dev/i2c-1
    volumes:
      - /sys:/sys
    environment:
      MODEL: "RAK5146"
      CONCENTRATOR: "SX1303"
      INTERFACE: "USB"
      HAS_GPS: "1"
      HAS_LTE: "0"
      RESET_GPIO: 0
      GPS_DEV: "/dev/i2c-1"
      RADIO_DEV: "/dev/ttyACM0"
      GATEWAY_EUI: "E45F01FFFEB93BC2"
      BAND: "as_915_928"
      SERVER_HOST: 192.168.0.119
      SERVER_PORT: 1700

  postgres:
    image: postgres:14.3-alpine3.15
    container_name: postgres
    restart: unless-stopped
    environment:
      - POSTGRES_PASSWORD=root
      - POSTGRES_USER=root
      - POSTGRES_DB=ttn_lorawan
    networks:
      - bridge
    volumes:
      - 'postgres:/var/lib/postgresql/data'
    ports:
      - "5432:5432"

  redis:
    image: redis:7.0.0-alpine3.15
    container_name: redis
    command: redis-server --appendonly yes
    restart: unless-stopped
    networks:
      - bridge
    volumes:
      - 'redis:/data'
    ports:
      - "6379:6379"

  stack:
    image: xoseperez/the-things-stack:latest
    container_name: stack
    restart: unless-stopped
    depends_on:
      - redis
      - postgres
    networks:
      - bridge
    volumes:
      - 'stack-blob:/srv/ttn-lorawan/public/blob'
      - 'stack-data:/srv/data'
    environment:
      TTS_DOMAIN: 192.168.0.119
      CLI_AUTO_LOGIN: "true"
      TTN_LW_BLOB_LOCAL_DIRECTORY: /srv/ttn-lorawan/public/blob
      TTN_LW_REDIS_ADDRESS: redis:6379
      TTN_LW_IS_DATABASE_URI: postgres://root:root@postgres:5432/ttn_lorawan?sslmode=disable
      WAIT_HOSTS: redis:6379, postgres:5432
      WAIT_HOSTS_TIMEOUT: 300
      WAIT_SLEEP_INTERVAL: 30
      WAIT_HOST_CONNECT_TIMEOUT: 30

    ports:
      - "80:1885"
      - "443:8885"
      - "1881:1881"
      - "1882:1882"
      - "1883:1883"
      - "1884:1884"
      - "1885:1885"
      - "1887:1887"
      - "8881:8881"
      - "8882:8882"
      - "8883:8883"
      - "8884:8884"
      - "8885:8885"
      - "8887:8887"
      - "1700:1700/udp"

  influxdb:
    image: influxdb:1.8
    container_name: influxdb
    restart: unless-stopped
    ports:
      - '8086:8086'
    networks:
      - bridge
    volumes:
      - influxdb-storage:/var/lib/influxdb
    environment:
      - INFLUXDB_DB=sensors
      - INFLUXDB_HTTP_AUTH_ENABLED=true
      - INFLUXDB_ADMIN_USER=admin
      - INFLUXDB_ADMIN_PASSWORD=changeme

  grafana:
    image: grafana/grafana:latest
    container_name: grafana
    restart: unless-stopped
    ports:
      - '3000:3000'
    networks:
      - bridge
    depends_on:
      - influxdb
    volumes:
      - grafana-storage:/var/lib/grafana
      - ./volume/grafana/provisioning/:/etc/grafana/provisioning
    environment:
      - GF_SECURITY_ADMIN_USER=admin
      - GF_SECURITY_ADMIN_PASSWORD=changeme

  node-red:
    image: nodered/node-red:latest
    container_name: node-red
    restart: unless-stopped
    entrypoint: /data/entrypoint.sh
    environment:
      - TZ=Europe/Amsterdam
    ports:
      - "1880:1880"
    networks:
      - bridge
    depends_on:
      - influxdb
      - stack
    volumes:
      - ./volume/node-red/data:/data
volumes:
  influxdb-storage:
  grafana-storage:
  node-red-data:
  redis:
  postgres:
  stack-blob:
  stack-data:

networks:
  bridge:
docker-compose.yml