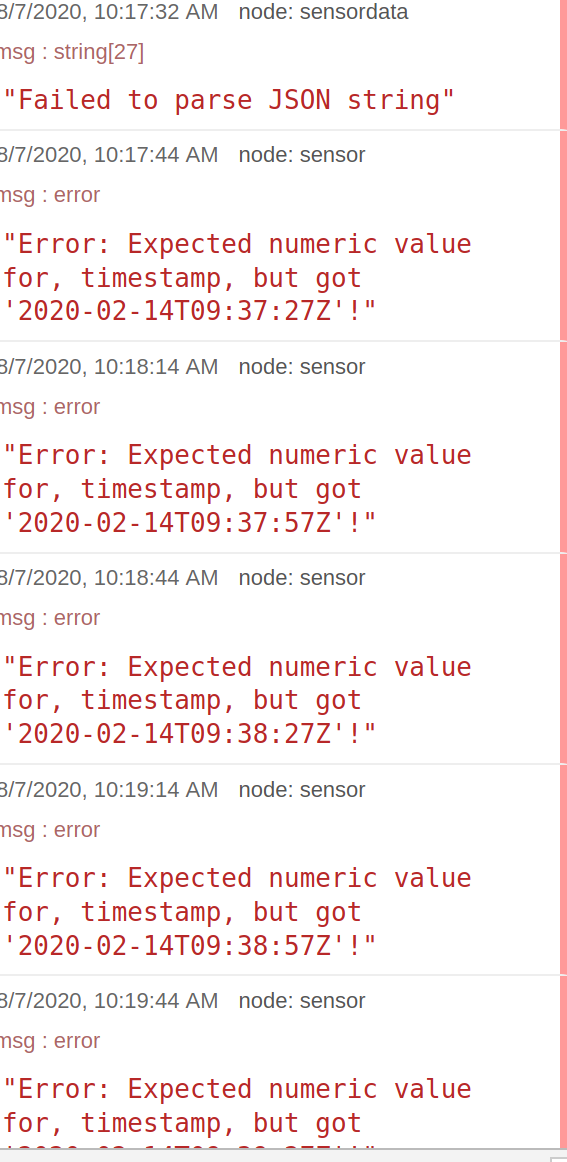
No received data from the sensor

Issue:
Hello everybody,
first of all i’m sorry because my english skill is not good.
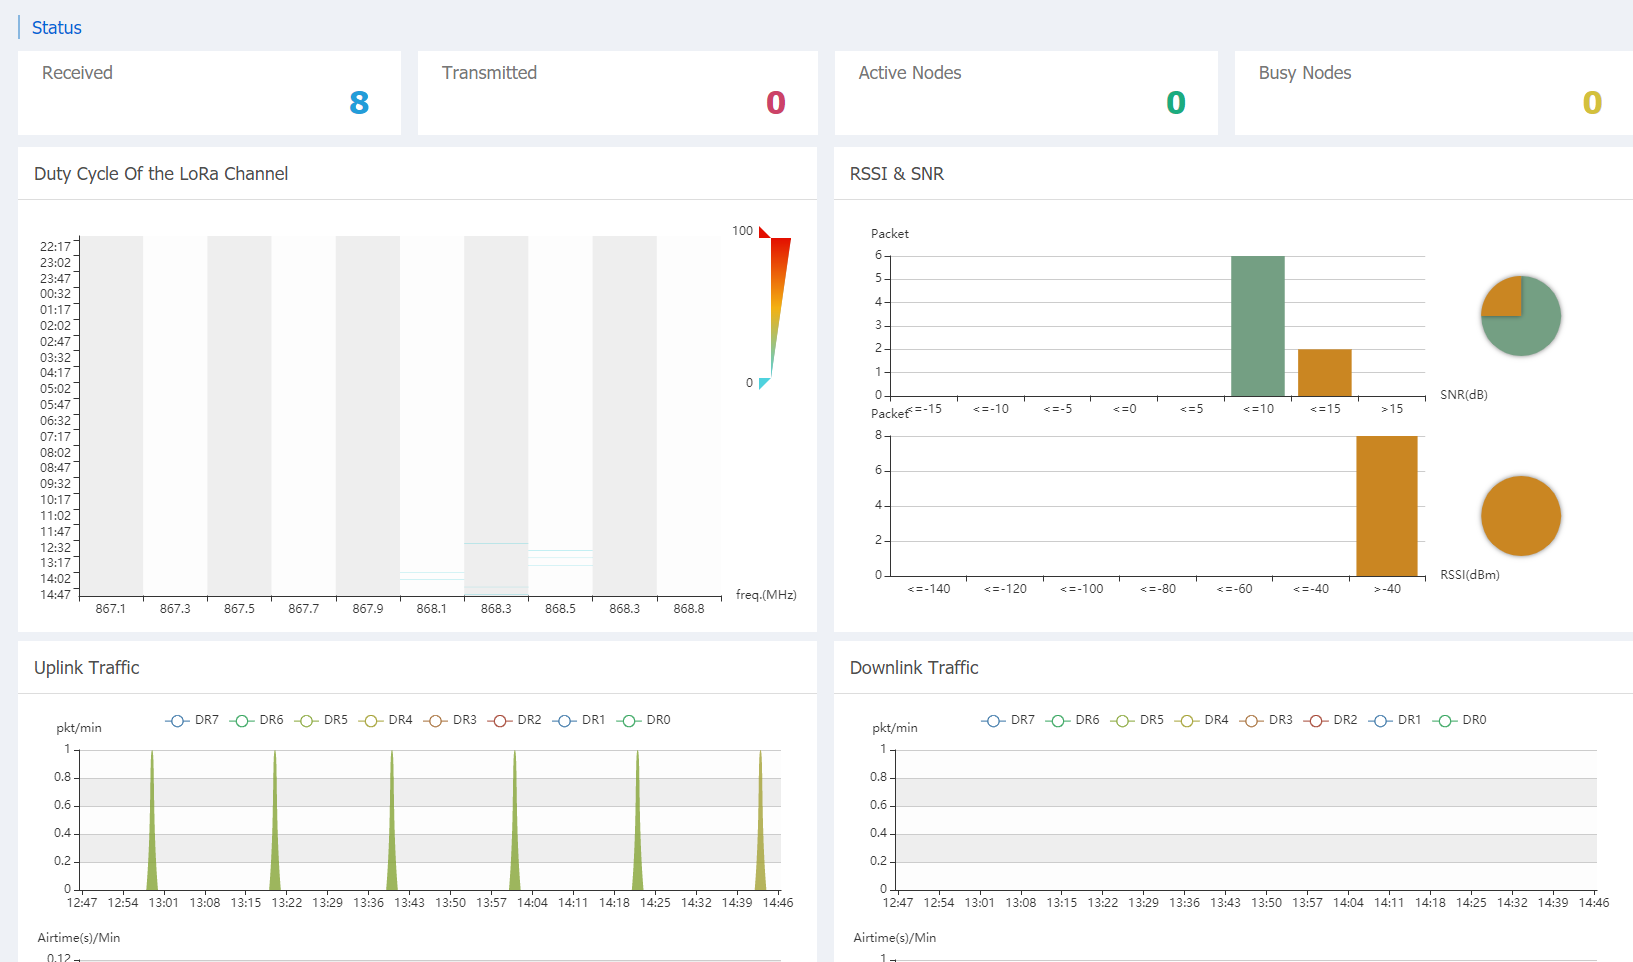
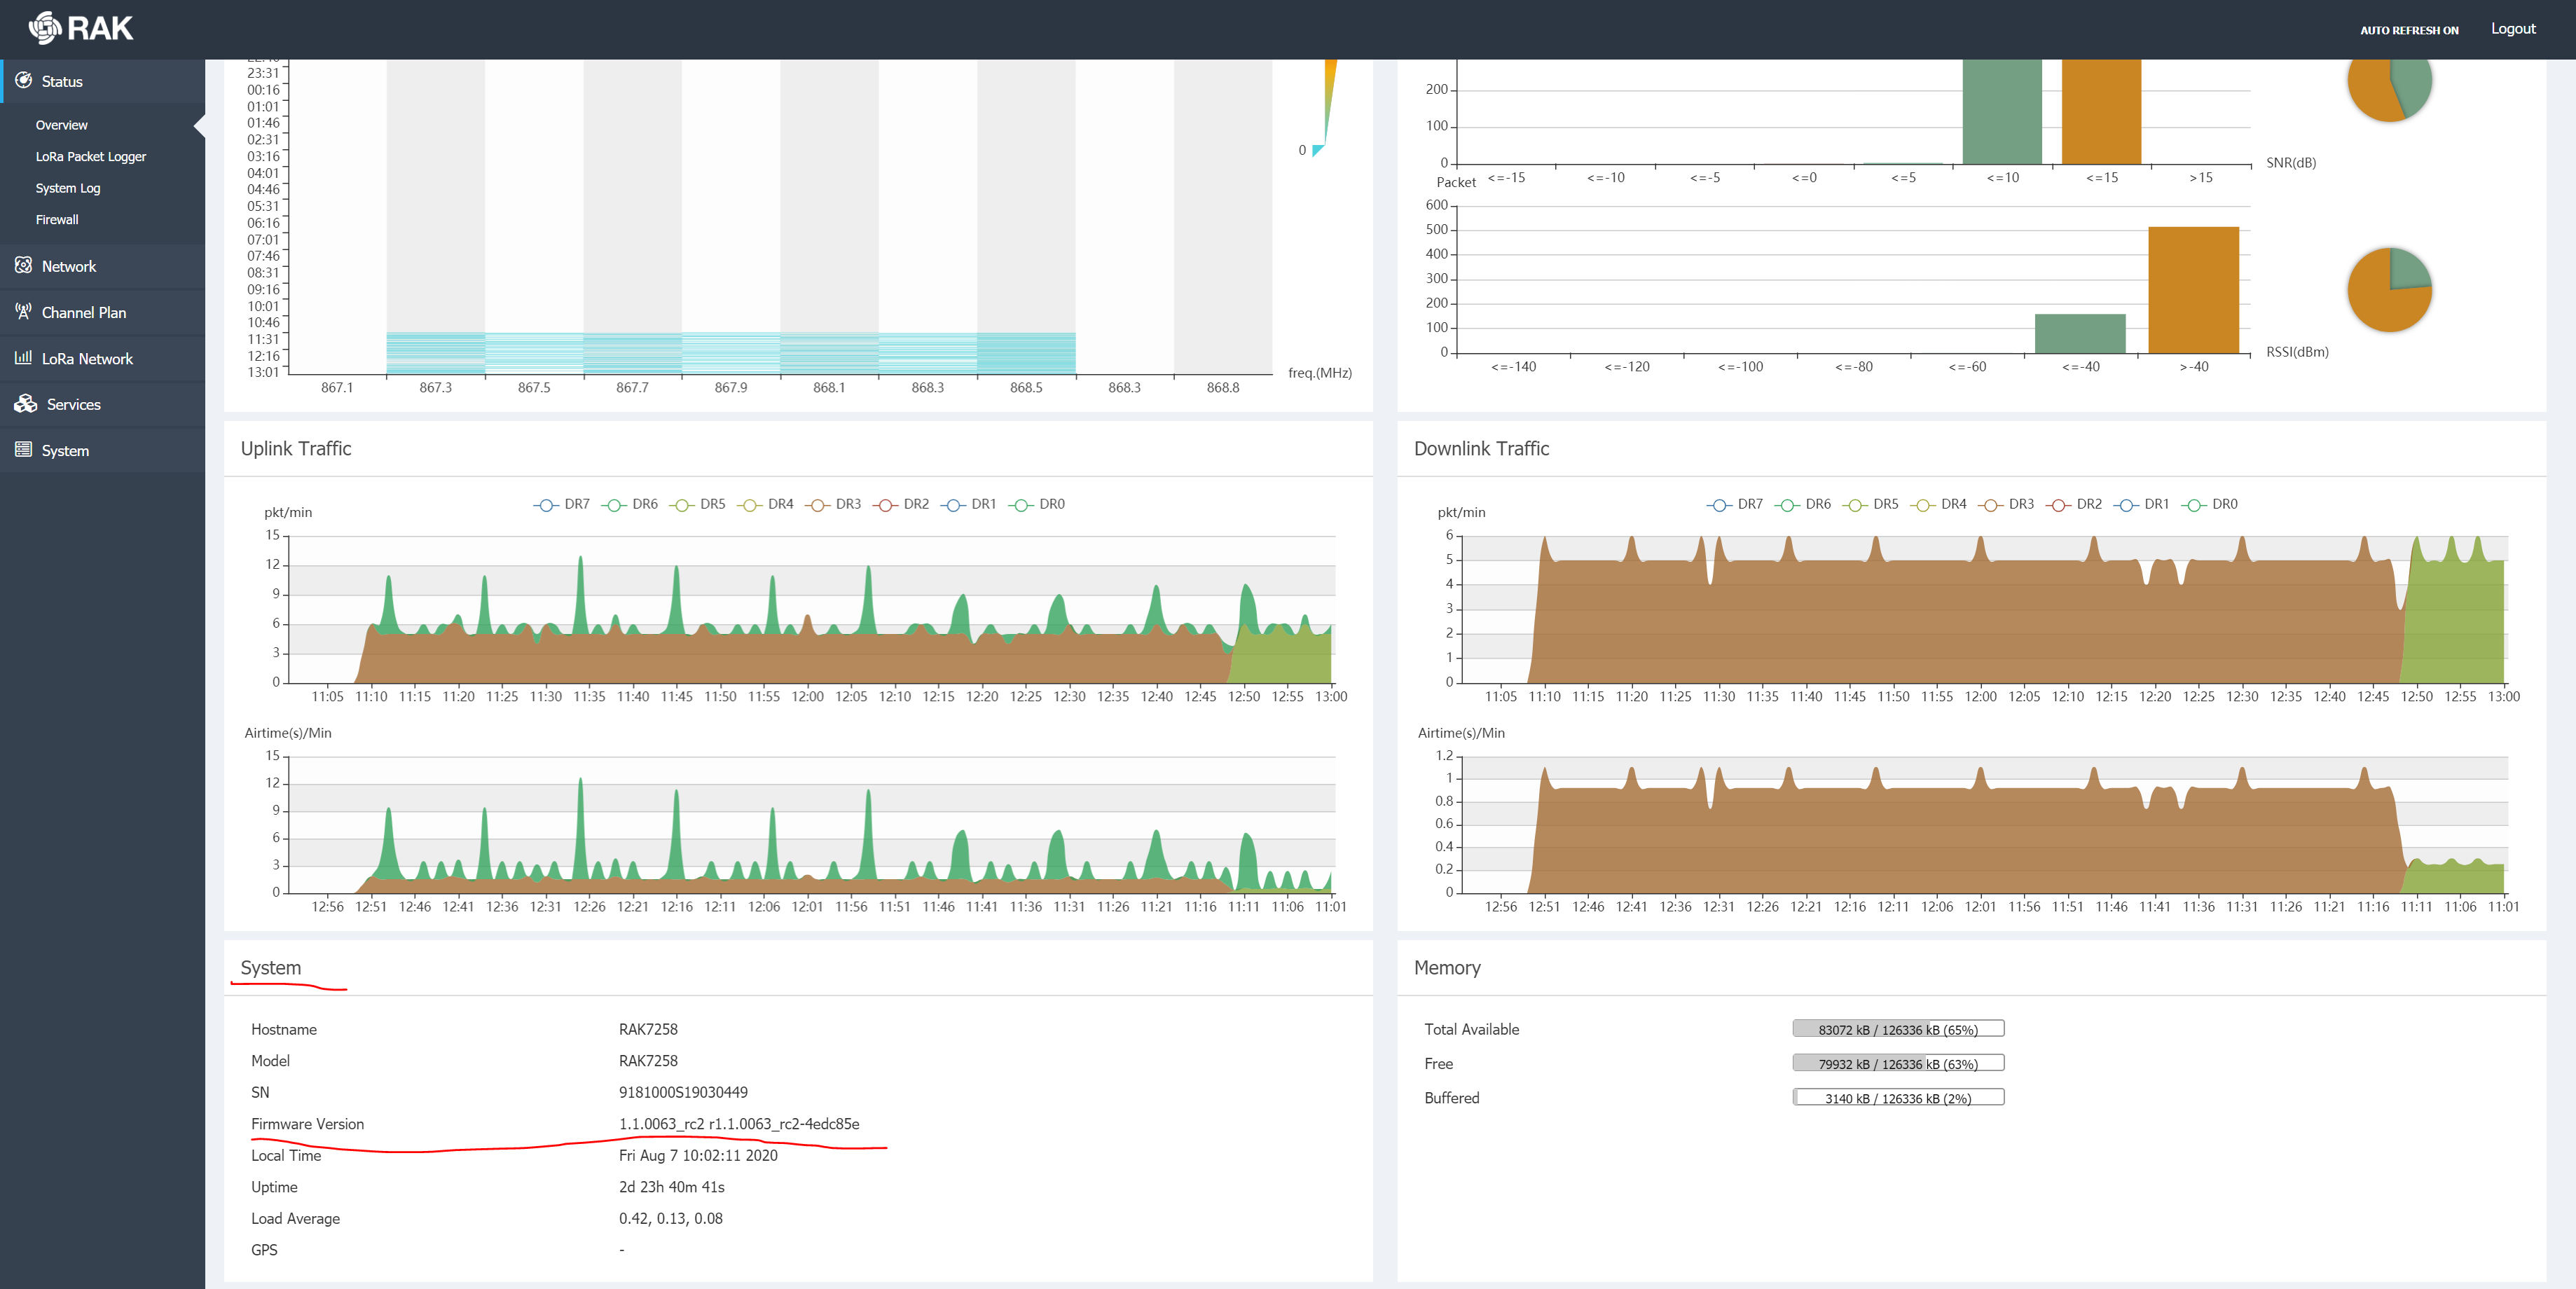
I currently have a project at the university. we have to transfer the data from the sensor ELSYS-ERS via the RAK7258 and NODE-RED to the InfluxDB and visualize the data with Grafana.The problem is that we didn’t get any data from the sensor. With the RAK7258 I set “LoRa Packet Forwarders” on the “Protocol” to “LoRa Gateway MQTT Bridge” and “LoRa Gateway MQTT Bridge” on “the LoRa Network Server Type " to " loraserver 2.x “. For” LoRa Network Server” I entered the data from the sensor on" Application ". This is my status overview

!
then I programmed it in node-red but no data is shown after the deploy.
can anyone help me with the problem?
Thanks so much in advance.

Hello @damvancuong ,

  1. From your screenshot, you can see that you are using the gateway of the EU868 frequency band. Is your node also in the EU868 frequency band?
  2. EU868 has a total of 16 channels. The gateway enables 8-15 channels. Does your node also enable the same channels?
  3. What lorawan ns do you use? Is it the built-in ns of the gateway? If so, have you added your node information to ns?
  1. yes, my node is in EU868 frequency band.
  2. I don’t know to check that, can you explain this to me
  3. yes i have added all information to ns

How to view the channel of a node, I think you need to contact your node provider, because the commands of each node provider are different.

From your screenshot, I can see that your node has been successfully joined.

Have you tried to send some data after the node joins successfully?

yes i have tried but we didn’t get any data from the sensor, just only that the node has been successfully joined… That’s the problem I’m asked to be helped.

below is what I did in node-red. it says “connected” but no data comes out

Hello @damvancuong, Maybe @velev will help U.

1 Like

The Node-Red says connected because it is connected to the MQTT server - it doesn’t mean it is connected to the device.

You need to look at the gateway logs to see what it is receiving when you get your device to send.

This should be the same place that you saw the join happen.

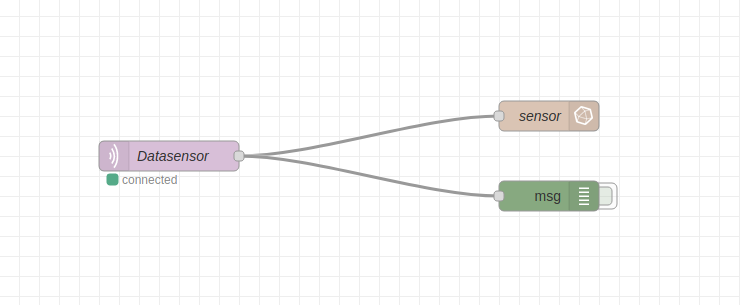
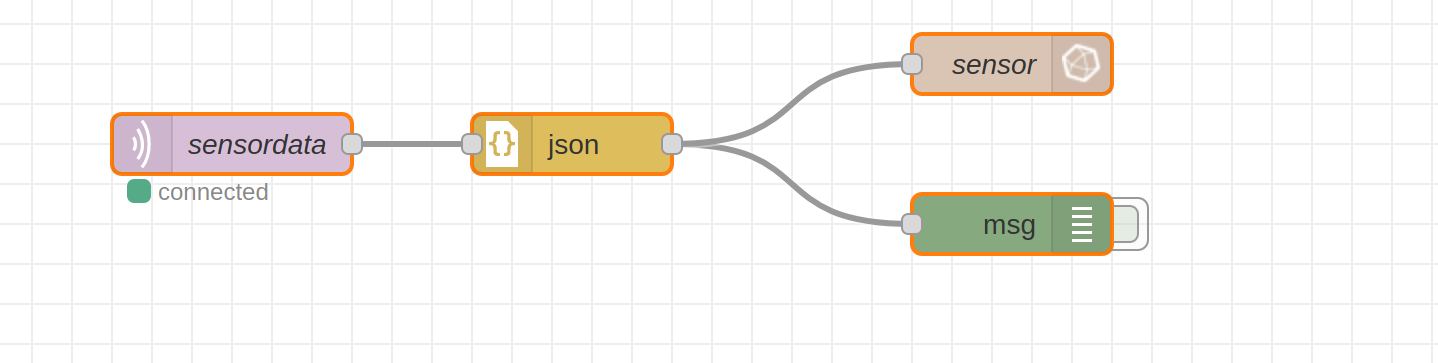
if i manually send this data from gateway downlink panel, then live device data show downlink packet however this is not happening in node red. there is no data coming out
.

First, you can edit posts, it’s the little pencil underneath your post - saves on deleting and retyping.

I would wonder if your device is hearing the join response - because if it doesn’t, it won’t be able to send any downlinks.

What country are you in - it would be worth checking the settings for the gateway and the device all match up.

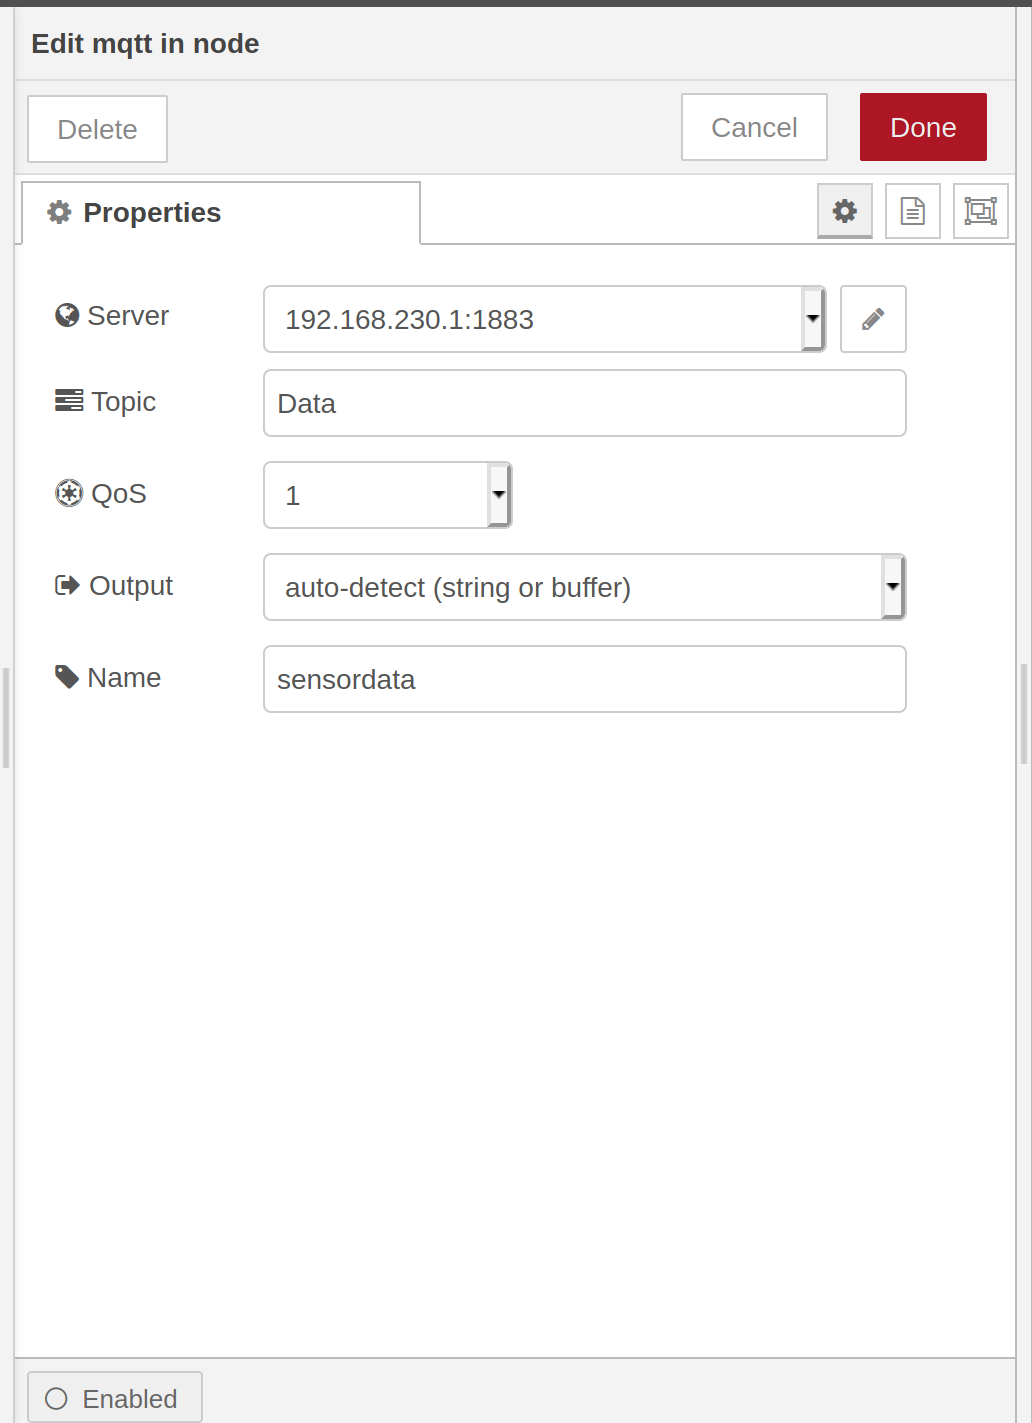
Hi @damvancuong as @nmcc suggested, let’s check your connection between the node and the gateway. Can you check at what period your node sends the data? Also, can you show us the Properties of the MQTT IN connector in node-red?

1 Like

hi @velev
my node sends the data per 20 minutes.
the Properties of the MQTT IN connector in node-red is as below.

You do not have topic Data in the Gateway. The topics that you can subscribe or publish to are:


If you want to be subscribed to all topics you can use the wildcard character “#”. And it is better to use “a parsed JSON object” in the Output field.

thanks a lot,
something happened not like before it didn’t happen at all.
but an error occurred that


i have added the json node but it is still “failed to parse JSON String”

can you also tell me what should i enter when i only want to be subscribed to one topic for example the Status Topic?

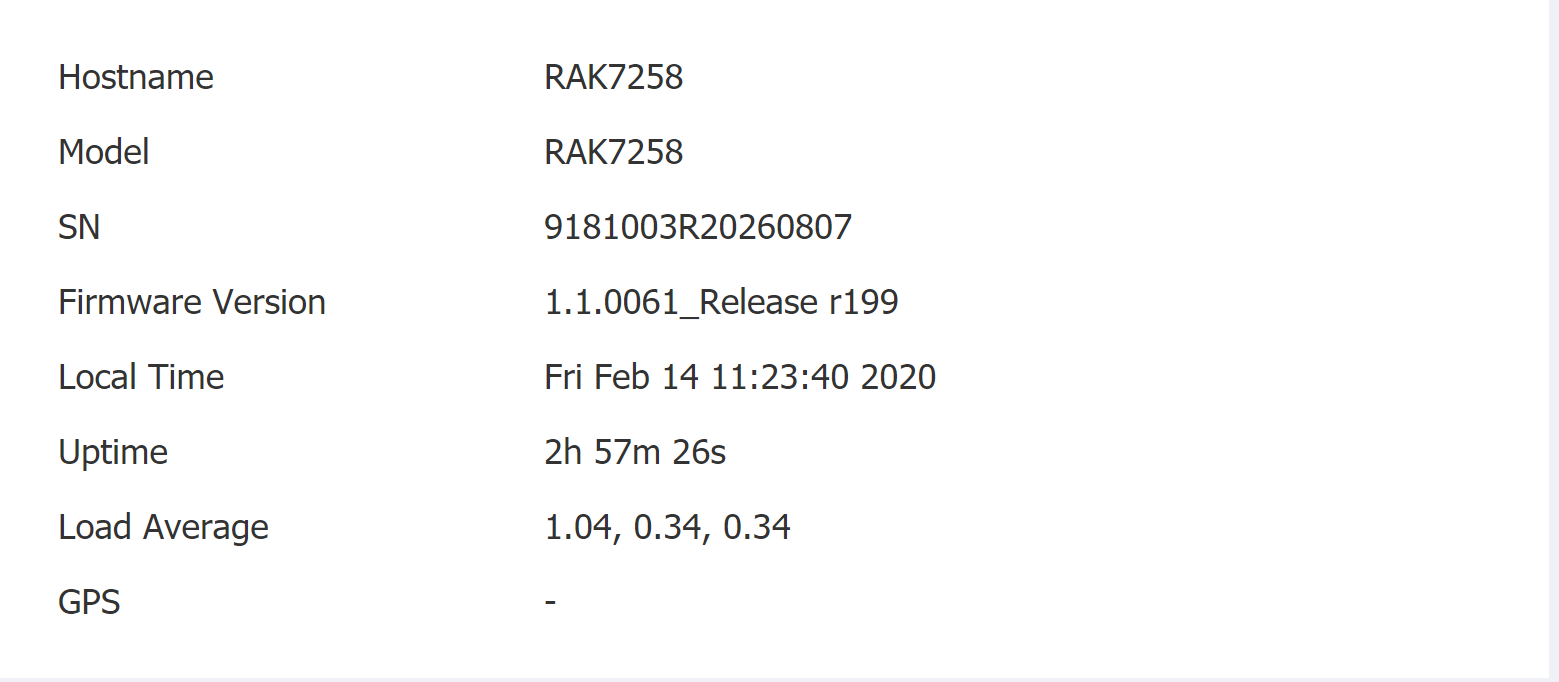
For the error can you check your Gateway firmware version?
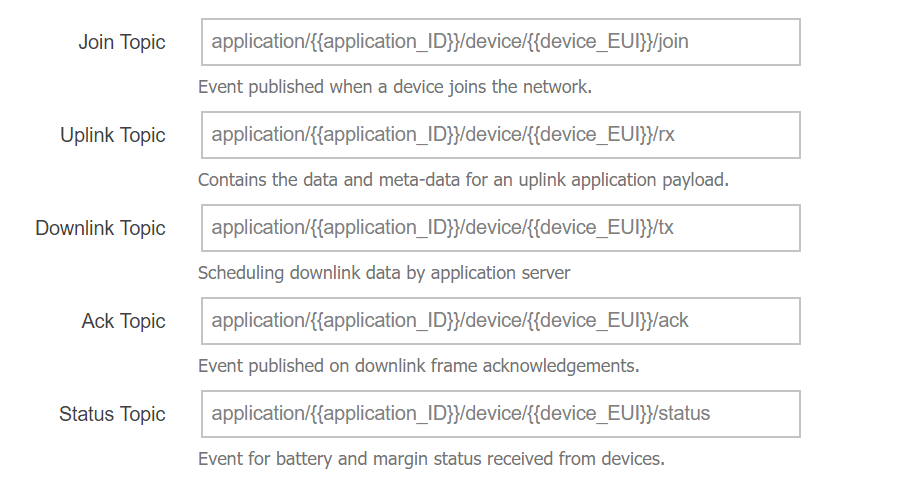
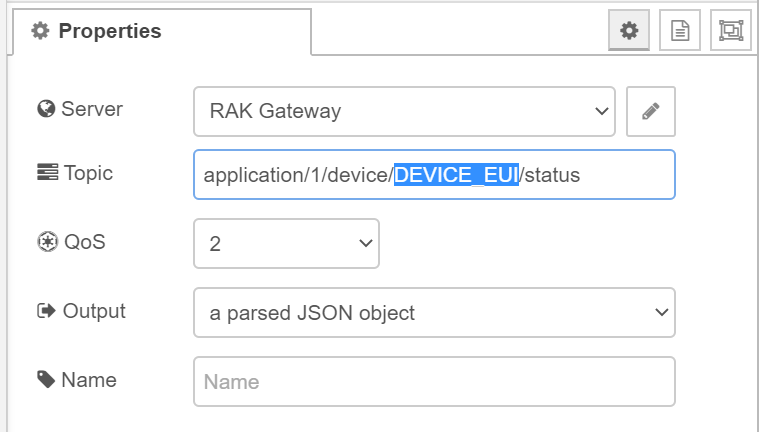
For topics, you need to change the data in the double curly brackets with your actual data.
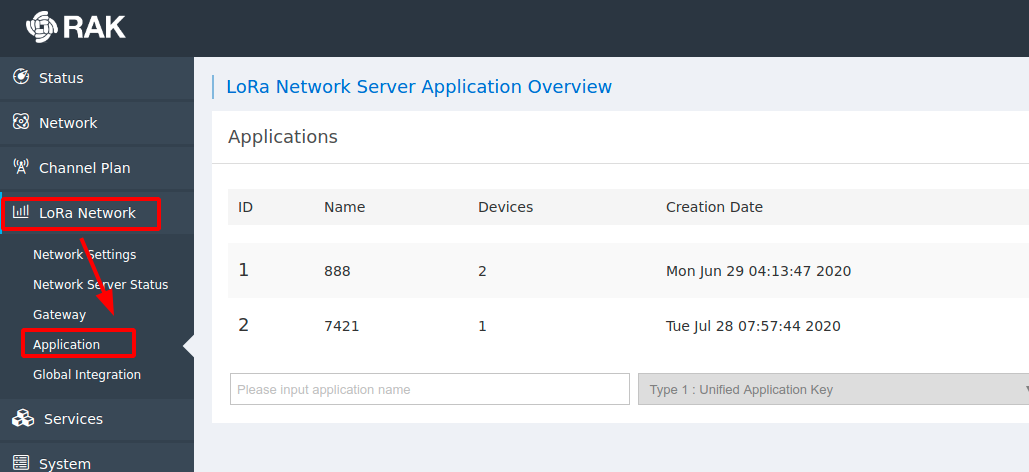
For example for status topic, it will be: application/1/device/DEVICE_EUI/status
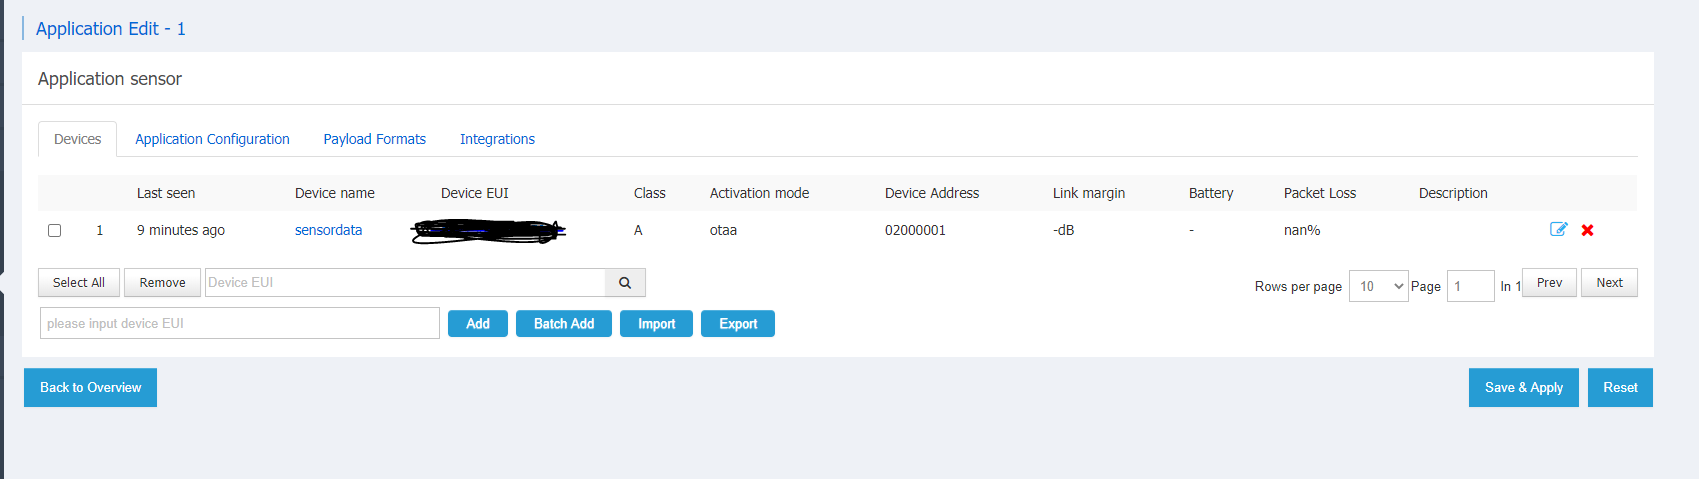
You need to change DEVICE_EUI with your real one.

my Gateway firmware version P01.005 RAK7258-03-142 868ME.
and in the Properties of the MQTT IN connector in node-red what should i enter instead of “#” for example for status topic?

Can you open the status page, and scroll down to System frame?

The correct topic is “application/1/device/DEVICE_EUI/status”
You need to change DEVICE_EUI with your real Devide EUI.

sorry this is my firmware version

Ok. Please update the firmware to the latest one RAK7285 Latest Firmware. Don’t forget to extract the bin file first.
Updating the firmware manual https://doc.rakwireless.com/quick-start/rak7258-micro-gateway/system Point 4.
And after that please check if the timestamp error persist in Node-Red.