
Hello. New to this forum and LoRaWAN. Trying to connect RAK10701 node to The Things Industries. Can someone explain what payload decoders are needed for the uplink and downlink messaging. Thinaks
Welcome to the forum @Tkirch
Did you go through the RAK10701-P Field Tester Pro Guide for The Things Network?
Payload decoders are shown in the 19th paragraph of the guide.
Yes. I copied and pasted the payload decoder shown into the uplink.
Not sure what is going on at this point. None of my end devices are joining the network now. I don’t think it is related to the RAK10701. I need to dig in deeper.
Is there a support number available for troubleshooting?
If with “support number” you mean a phone number, no that is not available.
We give support either here or through our help desk
What LoRaWAN region are you using?
Did you double check that a gateway is in range and shown alive in TTN?
Do you see the join requests in the gateway log in TTN. Or, if you have a RAK gateway, do you see the join message in the gateway logs?
Please share any log you can get, including the output from the USB port of the RAK10701.
Apologies for the delay. I am in the North American region and have my own gateway which forwards messages to The Things Industries/The Things Stack. I am also using a webhook to send data to Datacake.
I was able to get the uplink working by re-copying the payload formatter in for the uplink messages and then rebooting the gateway.
Next step is to get the RAK10701 to display the RSSI min/max and Gateway count.
Here is the log from TTI for the device. I was not able to get any logs from the RAK10701
arrow_downward
14:36:35
Schedule data downlink for transmission on Gateway Server
arrow_upward
14:36:35
Successfully processed data message
info
14:36:27
Fail to send webhook
arrow_upward
14:36:27
Forward location solved message
edit
14:36:27
Update end device
arrow_downward
14:36:27
Schedule data downlink for transmission on Gateway Server
arrow_upward
14:36:27
Forward uplink data message
arrow_upward
14:36:27
Successfully processed data message
info
14:35:27
Fail to send webhook
{
  "name": "as.webhook.fail",
  "time": "2024-03-10T18:36:27.861260666Z",
  "identifiers": [
    {
      "device_ids": {
        "device_id": "eui-ac1f09fffe0fb28e",
        "application_ids": {
          "application_id": "dragino-temp"
        }
      }
    }
  ],
  "context": {
    "tenant-id": "Cgpicm93YW50ZXN0"
  },
  "visibility": {
    "rights": [
      "RIGHT_APPLICATION_TRAFFIC_READ"
    ]
  },
  "unique_id": "01HRMTDSTNFW785EBRDH38S9EM"
}
There seems to be something wrong in the setup on TTN/TTS.
There are multiple “Fail to send webhook”. It looks like TTN has a problem here.
Double check the setup in TTN, specially the integrations to the Field Tester back-end and/or the integration to Datacake.
Btw, you should not use both at the same time. They might both try to send a downlink to the Field Tester, and I am not sure what happens in this case.
Hi Bernd. I have been away from this for awhile. I did get RAK7010-P fully working with TTN/TTS. All data appears on the device screen. The proper downlink decoder you suggested was the fix.
Now I am trying to visualize the data using Datacake but the uplink data is not showing in datacake. I created the uplink API, but not a downlink API. RAK node does not appear as connected in the Datacake console. Any tips to check the connection?
If you see the device and its uplinks in TTN but not in Datacake then there is something wrong with the connection between the two.
I guess you have setup the web-hook to Datacake in TTN?
Are there any error messages in TTN regarding the web-hook?
How did you register the device in Datacake? Should be LoRaWAN device with TTN/TTS connection, serial number == Device EUI.
In Datacake, do you see anything in the “Debug” tab of the device?
Yes webhook is setup to Datacake in TTN. I see one error message in TTN “Fail to send webhook” but when I look at Datacake the webhook message is received.
However, in the Datacake Device list the RAK Field Tester does not show a green dot next to it like my other devices.
Debug in Datacake shows “Error running payload decoder” and "Code error: threw error: Type error: Cannot access member ‘latitude’ of undefined’
Not sure what that is referring to, but I can see the Received webhook data and view the decoded payload.
The new payload decoder allowed the Field Tester to connect to Datacake. Thanks for the file!
All the fields allowed in Datacake are not being filled properly such as Min/Max RSSI which are always reporting matched levels, meaning there is no difference between Min and Max.
Is it possible to display the Lat/Long in Datacake or is there someway to correlate Lat/Long with RSSI value sampled?
Thanks again for your help!
How many gateways are receiving the packet from the Field Tester. Max and Min values are only different when there are at least 2 gateways that can receive the data packet.
To display the device location, you have to define a field for it from LOCATION_10 value:
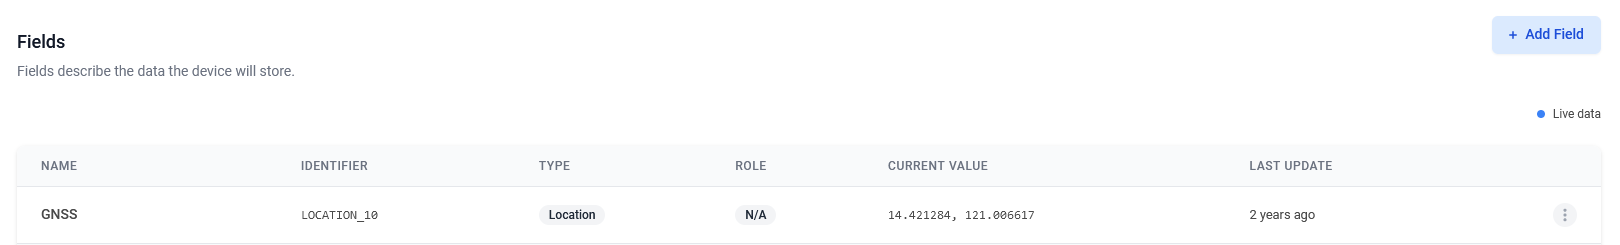
Then you can use the map widget to show it.
Regarding creating a combination of location and RSSI values, it might be possible in Datacake, but that goes beyond my knowledge.
I have two gateways up and active. Now I can see the different values for MIN/MAX.
I don’t see an option for GNSS as a field under the Add Field tab. I see
Name: Location, Identifier: LOCATION, Type: Location
Value: 28.392838, -81.534160
Maybe this is the same thing?
Yes, that is the location
GNSS is the name I give the field. You can choose any other name.
LOCATION_10 is the value coming from the payload decoder.
Cool. Thanks for the info. On another note. The display on my RAK field tester doesnt display anything as in blank not lit up. But is still operational and sending data. Is it repairable?
Does the display never show anything? Even after a hard reset (pushing the button next to the USB connector)?
It could be a loose FPC cable inside the enclosure.
After (carefully and slow) opening the enclosure you can check the FPC connections:
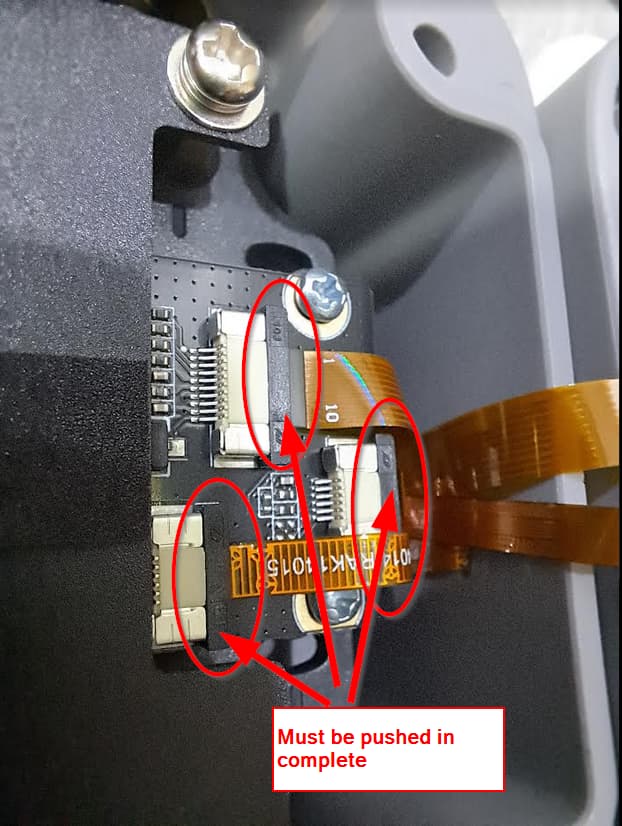
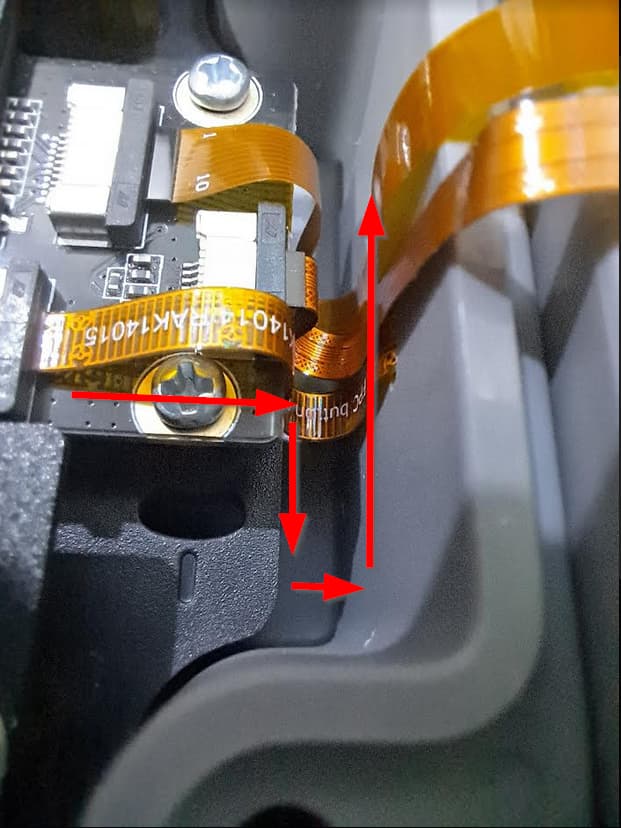
Another problem could be the way the FPC cables are bended/routed inside the enclosure. Check that the cables going down first after the connector before going up to the lid with the display.
There was nothing on the display. Side button didnt reset it. Cables looked ok. Disconnected and reconnected battery and display started working.
When you connect through USB to a terminal and you type ATC+PRD_INFO=?, what output do you get?
I am getting the feeling that you accidentally flashed a “standard” AT command firmware and not the RAK10701 firmware.
If ATC+PRD_INFO=? says “Command not found”, following Carl’s guide to flash the correct firmware ==> 10701 Issue…no screen & can’t restore to factory settings