RAK5205 OTAA fail

Hello,

I have a RAK5205 and loraserver.io. All setup and working fine with 2 other nodes (of different brand). With Wistrio I see successful boot-up:

RAK5205_TrackerBoard software version:2.0.0.6
LIS3DH init success!
ACC X:-16mg Y:0mg Z:0mg
BME680 init success!
T: 31.26 degC, P: 948.58 hPa, H 15.04 %rH , G: 9511 ohms
Please Configurate parameters…
Configuration OK!
app_interval = 10
gps_stime = 60
msg_confirm = 0
power_save = 0
Selected LoraWAN 1.0.2 Region: EU868
Board Initialization OK!

OTAA mode:
DevEui: 3638333567387F12
AppEui: 7ED5B370EE4C01D0
AppKey: D9988A5F02D80FAB8BA5F453C4A2CD2B
OTAA Join Start…

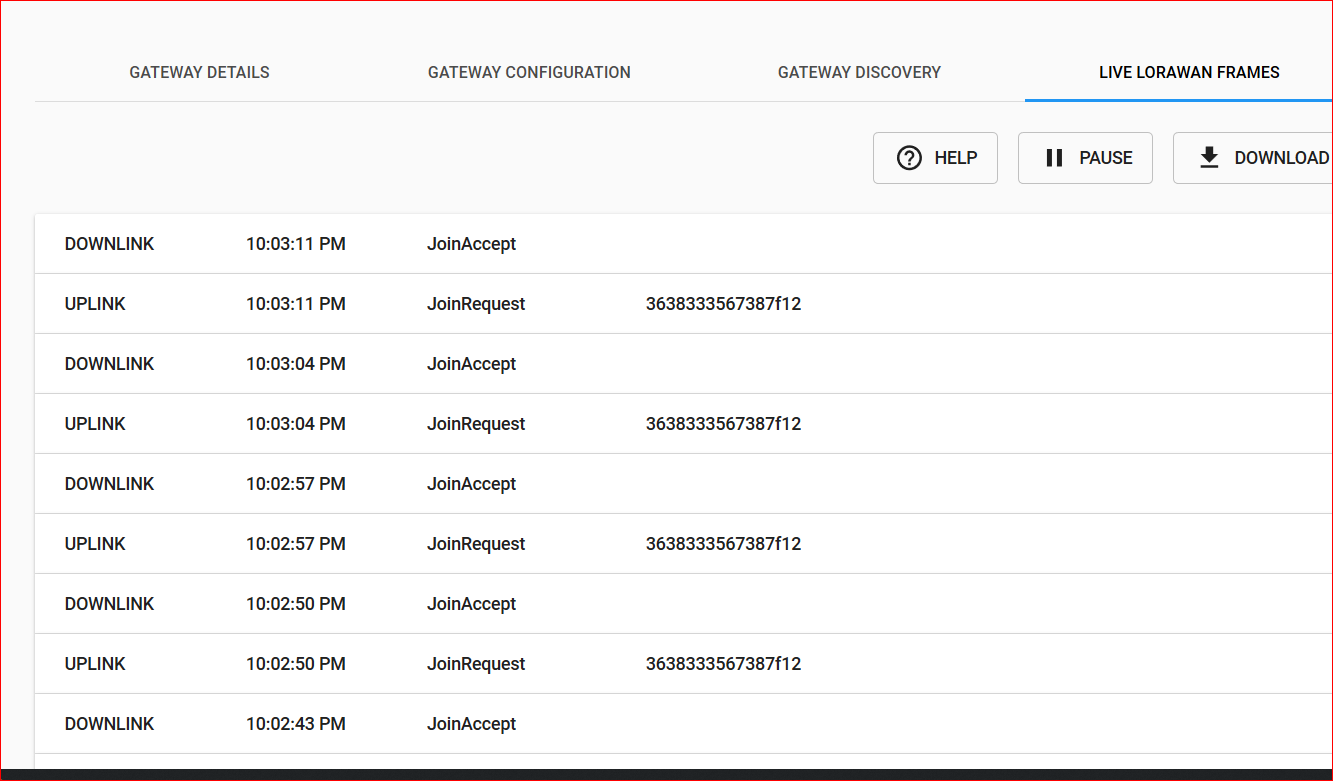
and I see JoinRequest and JoinAccept, but node is never activated and this goes in loop. Also do not see any join acknowledgement on wistrio side.

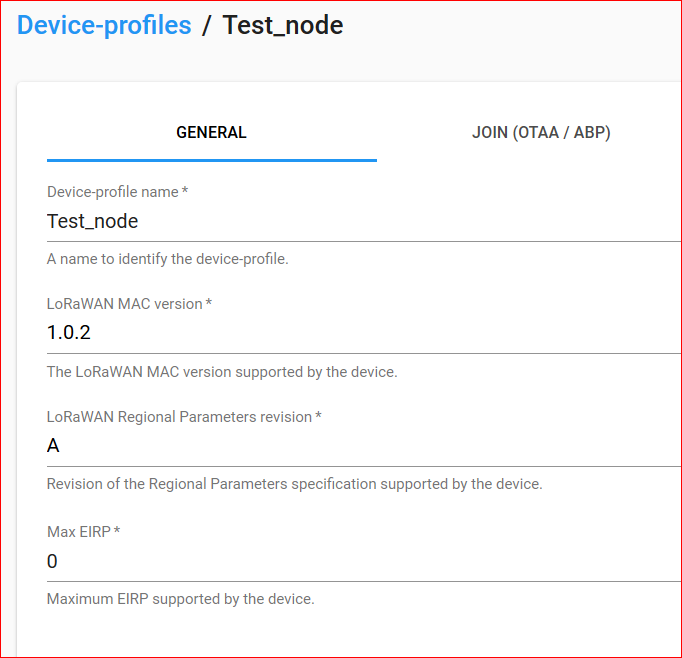
On server side I tried setting LoRa version 1.0.0 up to 1.1.0 (although I see it is 1.0.2). DevUI and AppKey configured as it should be. What am I doing wrong?

Many thanks,
Sergi

Hi Bro,

Can you use this command and see what LoRa Server reports on its side?

journalctl -u loraserver -f -n 50

Perhaps we will get some info on what is going on exactly, there should be an error message, suggesting as to why there is not activation.

maybe can see the gateway logs , check the loraserver have send the accept packet to the gateway (txpk info) with the right time and freq ,if it’s ok. should check the config with the end device .

{“tmst”:10547460,“chan”:0,“rfch”:1,“freq”:487.100000,“stat”:1,“modu”:“LORA”,“datr”:“SF12BW125”,“codr”:“4/5”,“lsnr”:12.0,“rssi”:-35,“size”:23,“data”:“APKCAdB+1bNwJAAmAEi9+kfAMOjZemQ=”}]}
JSON down: {“txpk”:{“imme”:false,“tmst”:15547460,“freq”:507.5,“rfch”:0,“powe”:14,“modu”:“LORA”,“datr”:“SF12BW125”,“codr”:“4/5”,“ipol”:true,“size”:17,“data”:“IDD6FWKUeeBjge/vlzkEmbA=”,“brd”:0,“ant”:0}}

Yes as @Yun suggests. Sometimes some of the parameters are wrong, or missing. For example datr: is not set properly, it will not go through as there is a parameter that is not accepted. This should be visible in the log.

Hobo, Yun

appreciate your suggestions, will try that shortly and let you know.

br

Here’s the output from loraserver:

time=“2019-03-10T21:45:42+01:00” level=info msg=“backend/gateway: uplink frame received”
time=“2019-03-10T21:45:43+01:00” level=info msg=“packet(s) collected” dev_eui=3638333567387f12 gw_count=1 gw_ids=b827ebfffe9d9733 mtype=JoinRequest
time=“2019-03-10T21:45:43+01:00” level=info msg=“device-queue flushed” dev_eui=3638333567387f12
time=“2019-03-10T21:45:43+01:00” level=info msg=“device-session saved” dev_addr=01a3775f dev_eui=3638333567387f12
time=“2019-03-10T21:45:43+01:00” level=info msg=“device-activation created” dev_eui=3638333567387f12 id=1137
time=“2019-03-10T21:45:43+01:00” level=info msg=“backend/gateway: publishing downlink frame” qos=0 topic=gateway/b827ebfffe9d9733/tx
time=“2019-03-10T21:45:49+01:00” level=info msg=“backend/gateway: gateway stats packet received” gateway_id=b827ebfffe9d9733
time=“2019-03-10T21:45:49+01:00” level=info msg=“gateway updated” gateway_id=b827ebfffe9d9733
time=“2019-03-10T21:45:49+01:00” level=error msg=“handle gateway-configuration update error” error=“get channel error: lorawan/band: invalid channel” gateway_id=b827ebfffe9d9733

occasionally followed by:
level=error msg=“processing uplink frame error” data_base64="****=" error=“validate dev-nonce error: object already exists”

as I looked in my loraserver.toml some basic configs:
[network_server.band]
name=“EU_863_870”
enabled_uplink_channels=[] (I played with these as well)

Seems correct.
But while I was playing around with the config, I noticed that join actually got through and I got first downlink/uplink. at this moment the only change I had done is just erased the channel list in loraserver gateway profiles, and put exactly same sequence back 0,1,2,3,4,5,6,7

Here is the output from loraserver logs currently, you can see I still have the channel error, but I also have downlink/uplink, so this error might be false positive?:

time=“2019-03-10T22:38:02+01:00” level=info msg=“backend/gateway: uplink frame received”
time=“2019-03-10T22:38:02+01:00” level=info msg=“rx info sent to network-controller” dev_eui=3638333567387f12
time=“2019-03-10T22:38:02+01:00” level=info msg=“device gateway rx-info meta-data saved” dev_eui=3638333567387f12
time=“2019-03-10T22:38:02+01:00” level=info msg=“device-session saved” dev_addr=0179c819 dev_eui=3638333567387f12
time=“2019-03-10T22:38:02+01:00” level=info msg=“adr request added to mac-command queue” dev_eui=3638333567387f12 dr=0 nb_trans=1 req_dr=5 req_nb_trans=1 req_tx_power_idx=2 tx_power=0
time=“2019-03-10T22:38:02+01:00” level=info msg=“pending mac-command block set” cid=LinkADRReq commands=1 dev_eui=3638333567387f12
time=“2019-03-10T22:38:02+01:00” level=info msg=“backend/gateway: publishing downlink frame” qos=0 topic=gateway/b827ebfffe9d9733/tx
time=“2019-03-10T22:38:02+01:00” level=info msg=“device-session saved” dev_addr=0179c819 dev_eui=3638333567387f12
time=“2019-03-10T22:38:03+01:00” level=info msg=“finished client unary call” grpc.code=OK grpc.method=HandleUplinkData grpc.service=as.ApplicationServerService grpc.time_ms=503.541 span.kind=client system=grpc
time=“2019-03-10T22:38:12+01:00” level=info msg=“backend/gateway: gateway stats packet received” gateway_id=024b0bffff0302d0
time=“2019-03-10T22:38:12+01:00” level=info msg=“gateway updated” gateway_id=024b0bffff0302d0
time=“2019-03-10T22:38:12+01:00” level=error msg=“handle gateway-configuration update error” error=“get channel error: lorawan/band: invalid channel” gateway_id=024b0bffff0302d0

Still puzzled where is the bottleneck, I think I will same topic with loraserver team as well.

Any ideas are welcome, and once again many thanks to you both, Hobo and Yun for feedback and hints.

Br

Hmm… that is weird to my understanding. Is this with log_level=5 ?
What does “at+get_config=ch_list” say ?

it is level4, debug mode was giving too many unnecessary details.
As for the frequency, here’s the output from wistrio:

0,on,868100000,0,5;
1,on,868300000,0,5;
2,on,868500000,0,5;
3,off;
4,off;
5,off;
6,off;
7,off;
8,off;
9,off;
10,off;
11,off;
12,off;
13,off;
14,off;
15,off

Looks like it has the minimum set.

Have you tried to only enable the 0, 1, 2 frequencies in the toml and see what happens. Just guessing to be honest.

I investigated a bit further and it seems this is not uncommon for TTN also. The problem is that timings are something very critical, hence you miss the activation window so to say.
This should not be the same for ABP, ABP should work fine. Have you tried it?
If possible could you go for the ABP route just to see if the issues persists, it shouldn’t. If it disappears than perhaps it is a firmware issues to some degree. There are workarounds, for TTN, however for loraserver I think doing as you suggested (post in the loraserver forum) might lead to a solution. Brocaar is really knowledgeable and will atleast have a suggestions.
Sorry for not being able to help more, still learning myself.

Well, that sounds reasonable and pretty much can explain the randomness. Many thanks for your help and time. will be posting here if I find a permanent fix.

[Edit] - will try ABR as well

Let us know if you have any progress. Perhaps @Fomi might shed some light on it, as he is the one that knows best :slight_smile:

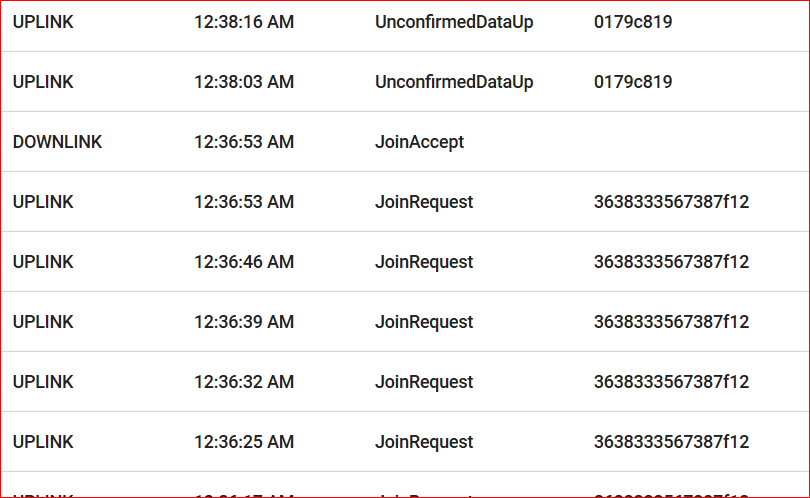
after updating loraserver to 2.6.0 it seems that join has improved a bit, I still get repetitive Join request/accept, but shortly it goes through. checking more

Yes this is our experience as well. Basically it is a timing issue the node doesn’t wait long enough to get the join request ack, and sends another request, etc. After 3-4 we get connected, this should not happen with ABP as there the key are pre-generated. I think this is an issue with all LoRa Nodes we used so far with TTN, I think this is not present in LoRa Server for some reason. Also RAK811 seems to connect right away. Perhaps @Fomi could look into increasing the timeout for the ARQ in the OTAA procedure in order to avoid this issue :slight_smile:

Here is my setup for comparison:
Nodes: Nucleo, RAK5205
GW: RPI+IMST, RPI+RAK2245

I am thinking if I have to consider also the RTT of my GW and server connections, less possible through as am testing from 2 different geolocation.

Hi,
i have quite the same problem but it only concerns the node side.
I’m trying to connect a RAK5205 node on Objenious (french operator) with the 3 last firmwares :

  • RAK811_HF_trackerboard_V2.0.0.6.bin
  • RAK811_HF_trackerboard_V2.0.0.7.bin
  • RAK811_HF_trackerboard_V2.0.1.8.bin

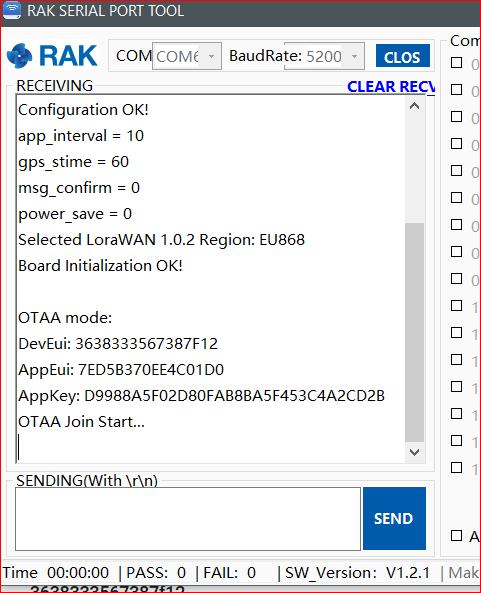
And it can not join, here is the debug infos that I obtain :

RAK5205_TrackerBoard software version:2.0.1.8
LIS3DH init success!
ACC X:16mg Y:-48mg Z:-128mg
BME680 init success!
T: degC, P: hPa, H %rH €ßÿû÷L‚H€÷ÿConfiguration OK!
app_interval = 10
gps_stime = 60
msg_confirm = 0
power_save = 0
Selected LoraWAN 1.0.2 Region: EU868
Board Initialization OK!

OTAA mode:
DevEui: 007CDD19C3F7XXXX
AppEui: 70B3D57ED0018XXXX
AppKey: 0780234B54677AB13E80CE19B334XXXX
OTAA Join Start…
latitude: , longitude: , altitude: 0 ;
OTAA Join Failed!
Retry OTAA join.

The board seems to initialize correctly, the keys are correct also (I was just wondering about all this weird characters at the beginning).
I also have an old firmware (maybe before 2.0.0.0) that I modified to add some new functionalities and it works fine with this keys, so I’m sure they are good. I don’t understand why I can’t manage to make it work with the new versions that have some improvements I’d like to use.

Thanks for your help

Hi @JCDS.
This is very strange behavior.
Please flash again with 2.0.1.8 from here RAK5205-WisTrio-LoRa Git and try again.
Let me know what happened.
Regards

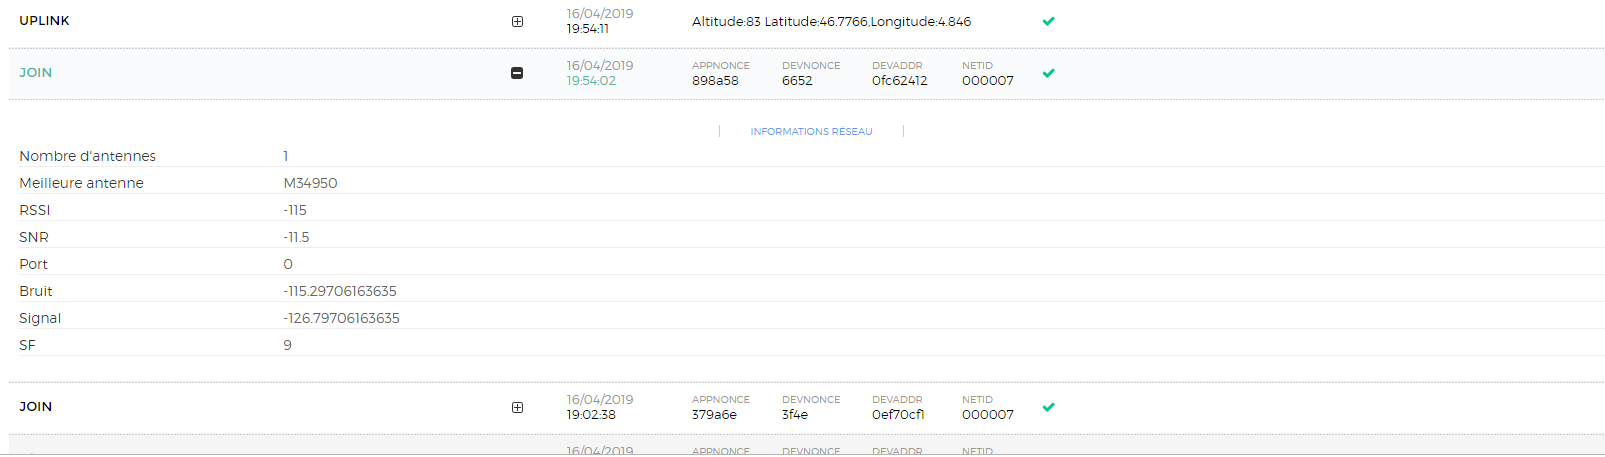
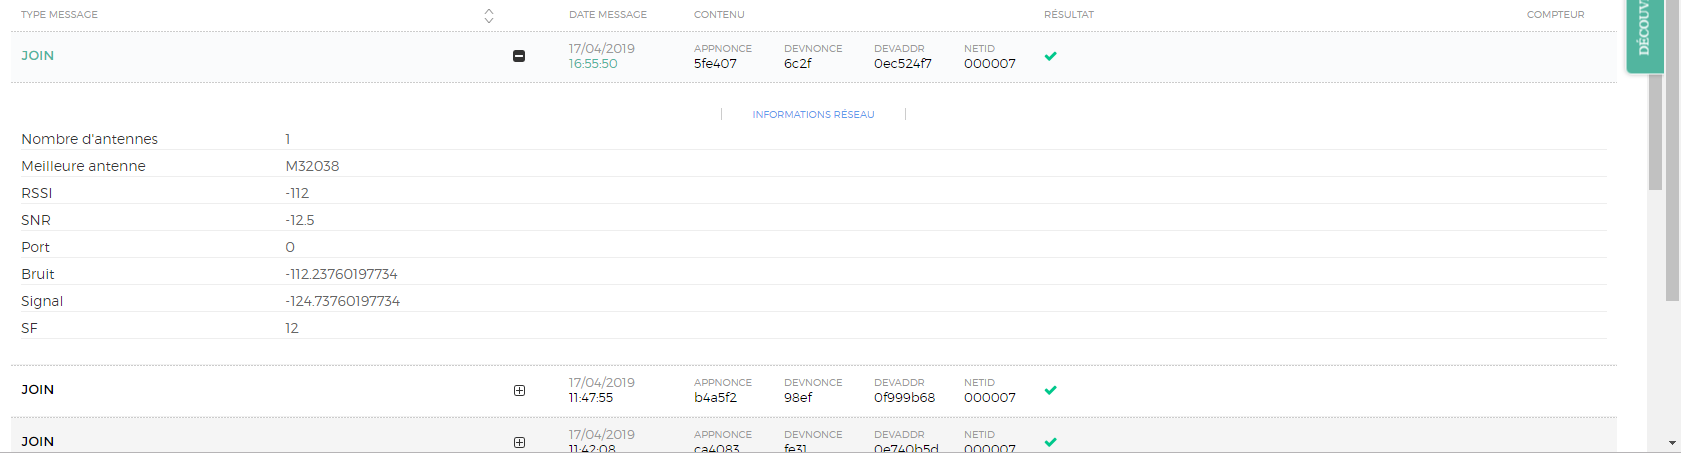
PS Are you using TTN or LoRa Server? Give screenshots from join uplink.

Hi velev,

Thank you for your answer.
I flashed again with 2.0.1.8 Fw, but the behavior is the same.

The old firmware that works is :
RAK811 BreakBoard soft version: 1.1.3 Selected LoraWAN 1.0.2 Region: EU868.

I’m not using TTN, I use a french Lora provider “Objenious” and here are some screenshots, not sure it helps :slight_smile:
Thanks

And here is the debug from serial port :

RAK5205_TrackerBoard software version:2.0.1.8
LIS3DH init success!
ACC X:-16mg Y:0mg Z:0mg
BME680 init success!
T: 31.70 degC, P: 997.04 hPa, H 30.84 %rH , G: 6376 ohms
Please Configurate parameters…
Configuration OK!
app_interval = 10
gps_stime = 60
msg_confirm = 0
power_save = 0
Selected LoraWAN 1.0.2 Region: EU868
Board Initialization OK!

OTAA mode:
DevEui: 007CDD19C3F7XXXX
AppEui: 70B3D57ED001XXXX
AppKey: 0780234B54677AB13E80CE19B334XXXX
OTAA Join Start…

I can at leat confirm that I have been able to make the RAK5205 works on the Objenious network with firmware 2.0.0.6 & 2.0.0.7 (did not try the 2.0.0.8 yet)