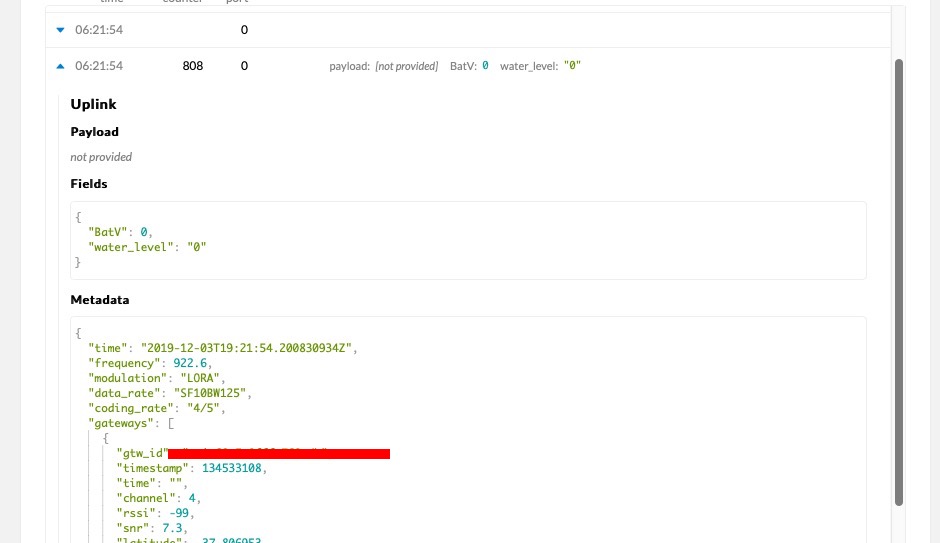
I have three devices sending through 1 gateway RAK7249, all working well for last 2 months. From about 1am last night data from each device was all “Payload not provided”, and from Port 0.
So they are all transmitting on schedule, but just with no payload.
The gateway is relatively remote (4 hours away).
Appreciate any ideas on what could be causing this issue?
Hi. This cant be related to Gateway i think. You can check your payload decoder in TTN first. Then Try to send both confirmed and unconfirmed downlink to your devices. And give feedback here please.
Traffic on port 0 is for network management purposes only and does not include any application-level payload.
The more interesting question would be why you are suddenly getting only this type of traffic. It could be anything from a server issue to a connectivity issue to a bug in node firmware. Looking at the fopts field in the header and any mac commands in the body of the packet would be the path to start debugging that.
We’ve since observed the same issue on nodes of the same type transmitting via a Sentrius RG191 gateway we have, but we also have a different make of nodes transmitting normally through that second gateway. We’re thinking like @velev that its not a gateway issue.
The commonality is the specific node type, and the TTN server / application server. As @cstratton observes, its a fairly wide area to start looking.
It is interesting that this problem began simultaneously in multiple nodes, in different locations. One of the areas we are looking at is how the node is instructed to configure Lorawan Network/Appication parameters, and if a change in a library file could produce a simultaneous change in all nodes looking to that library.
It’s not that wide a search. You should be able to see the MAC commands or whatever that are in the fopts or body of the port 0 packets on the TTN console. Examine both uplink and downlink packets - if you are only seeing one direction, that is probably part of the problem.
Probably something has gotten stuck in a loop resending something not being acknowledged from the other side.
For a bunch of nodes to start doing it at once suggests either a server-side glitch, something triggered by a period of no connectivity while gateways or gateway<>server connection was down, or a bug in a protocol implementation triggered after a certain amount of uptime.
Hi Chris, Thanks so much for your help with this.
Looking back at the histories, everything was normal right up until the first bad transmission, and the first bad transmission (Port 0, payload not provided) was received on schedule 15 minutes after the previous. There doesn’t seem to have been a period of no connectivity, so I will focus in that area of server-side glitch, or bug in the protocol implementation.
Message Type = Unconfirmed Data Down
Direction = down
FCnt = 245
FCtrl.ACK = false
FCtrl.ADR = true
The affected nodes are DraginoLSN50 v2 from their docs: LSN50 wireless part is based on SX1276/SX1278 LSN50 MCU part uses STM32l0x chip from ST LSN50 is an open source product, it is based on the STM32Cube HAL drivers
You need to decode the uplink packets that were sent on port 0
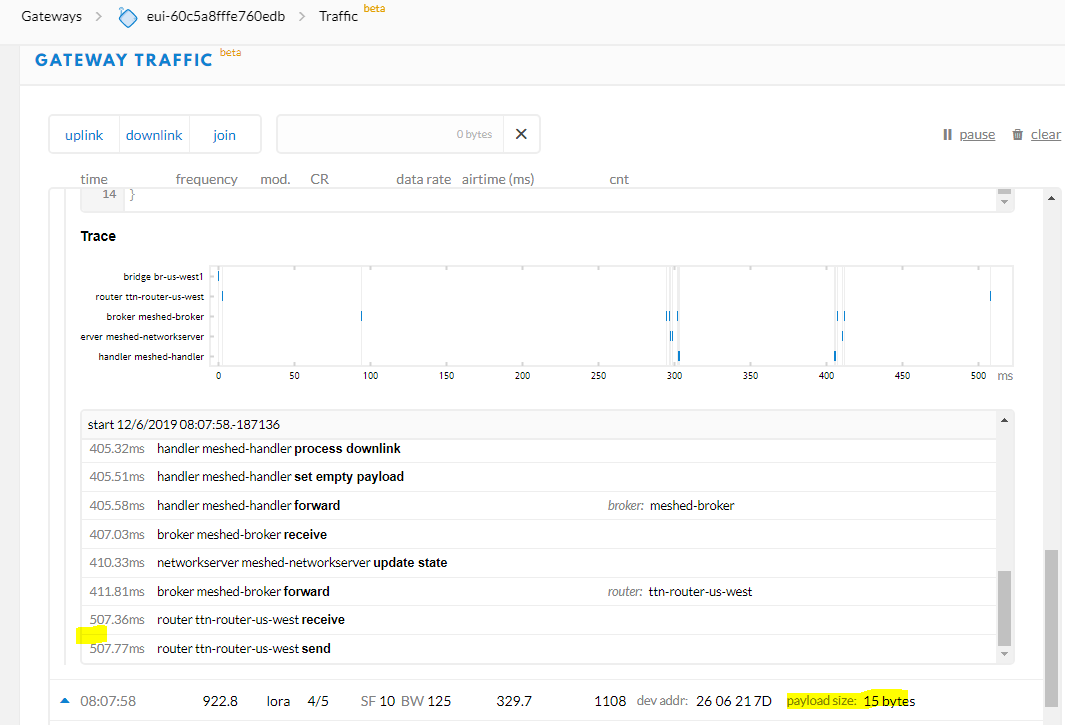
As for your downlink
This is a LinkADRReq which is to say the network telling the node to switch drtxpower 0x50 and map a certain group of channels. Guessing you are using AS923 that seems to be commanded a switch to SF7, but your node seems to be ignoring it and staying on SF10, which likely means it’s going to be sent over and over as long as the node has the ADR bit on it its uplinks.
Anyway, it’s really the fopts of the port 0 uplinks that you need to look at.
Are you absolutely sure your node, gateway, and TTN records are all for the same LoRa region?
not sure if relevant but the AT command returns:
AT+RX1WTO=7
AT+RX2WTO=7
“Are you absolutely sure your node, gateway, and TTN records are all for the same LoRa region?”
Gateway is AS923 (920-923)
Node = Ver AS923 (firmware has 1 version covers both 920-923 and 923-925)
TTN is Asia 920-923
How did you get to FCnt 3? If you just re-started the node then you may be hitting FCnt rollback protection. If FCnt has rolled forward across the 16-bit boundary it’s possible that the higher bits were lost instead of retained internally and used in the checksum calculations.
TTN is Asia 920-923
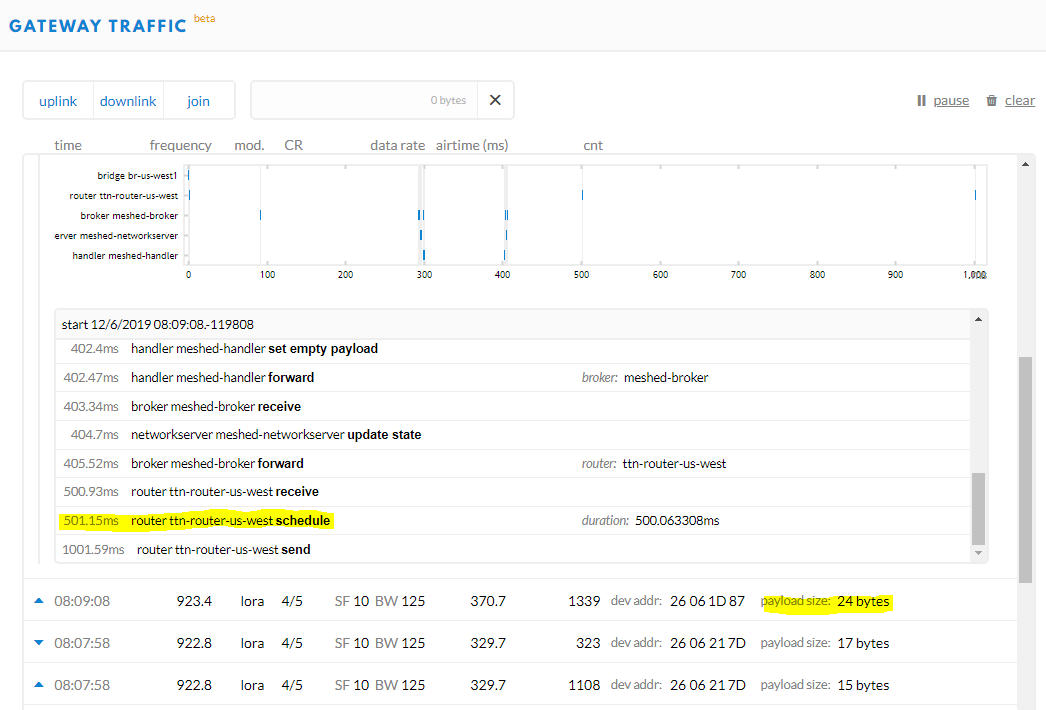
Is it normal then for your traffic to be going by way of ttn-router-us-west? Maybe it is, it just seems surprising for that region.
Late yesterday the Dragino engineers started to look into it and I was following their instructions trying different things and would reset certain nodes via downlink command. The reset would push the Fcnt to 0, so the screen grab would have been a couple of transmission after that. Consistently the first uplink transmission would be normal, but then would come the downlink and everything bad after that.
I passed on your observations @cstratton and soon after I was advised they understand the issue and are working on a solution.
Yes that “ttn-router-us-west” looks strange, I cant explain it, and I dont see it in the traffic this morning even as the issue continues.
Thanks again Chris for your help on this. Hopefully Dragino come back with some positive news and I will post it here.
Our instructions are to recompile the project or wait for firmware update.
If anyone can give a not too technical explanation of how the solution fits the symptoms I would love to get a better understanding. Anyway we will apply the fix today to some nodes we have in the office and see what happens.
I think it means we have no choice but to retrieve affected nodes from the field, I don’t see that we can apply this fix remotely?
Without seeing this code in full context it is hard to know if it would help.
It appears to be considering the case where an uplink needs to be sent and some fOpts also need to be sent and the total would be too large to fit in a packet at the current spreading factor, but it’s not all that clear that the logic is correct.
You could try it on a node or two which are at hand to test on, before those in the field.
The device need to be retrieved to upgrade the firmware.
from Dragino:
There is a bug in the device, if there is a ADR message from the server and the device can’t handle. the device will uplink a empty payload. In our side, if we set the device to unconfirm mode. the device can upload properly. What is strange in your side is that the server keep setting a downlink and the LSn50 can’t parse it so caused this endless loop issue. We will fix this bug in future firmware here.
I’m unconvinced that is the actual issue in this case, or that the fix is actually correct. That’s especially because its not possible to fully analyze when two lines of code are quoted out of context.
If the downlink were correctly decoded and applied, then the next uplink would be at an SF fast enough for fitting things into the packet to not be an issue.
Again, I’d recommend you try this on a node you have access to before you go pulling ones in from the field.
Yes the plan is to fix the ones with easy access first, will post the result here. Massive pain in the ass to go and retrieve field units - but it could be worse (imagine if we had hundreds off nodes, not dozens).
Thanks again for your time and valuable input into this issue,